
How we researched this article
BestProps used document-based research from primary firm sources, checked September 20, 2026. The complete source list, scope, limitations, and commercial-state record appear near the end of this article.
In ICT Forex & Futures Market Review \ October 15, 2025, published on 15 October 2025 at 11:44 Pacific time (18:44 UTC the same day) and running 18 minutes 44 seconds, ICT reviews the US Dollar Index, EUR/USD, GBP/USD and the December E-mini Nasdaq-100 futures contract. His commentary combines graded candle wicks, fair value gaps, opening prices, liquidity levels and specific intraday time windows.
The recording is best understood as an explanation of ICT’s own chart-reading framework. The transcript records what he said about the session; it cannot confirm the chart annotations, establish executions or show what happened afterwards, and the reviewer did not see the recorded charts.
Forex: limited directional conviction
US Dollar Index
ICT begins with the Dollar Index on the daily and five-minute charts. At 00:22, he says that for the market to stay bullish he did not want to see it come back down inside what he calls a suspension block; if it instead keeps retracing into that area, he treats deeper retracements as more likely.
His broader message is caution rather than a firm forecast. At 01:57 he describes the forex market as sitting in an area without one direction over the other, and says that is why he is concentrating on Nasdaq futures instead.
EUR/USD wick quadrants
For EUR/USD, ICT grades selected candle wicks into quadrant levels. At 03:24 he marks 1.16220 as the upper quadrant of the longest discount wick and 1.16325 as the upper quadrant of the shorter one, then describes price running up to 1.16380 — the high of that discount wick — before breaking lower to 1.16220 and rallying back to 1.16325 (03:42).
He then labels the surrounding structure with concepts from his methodology, including a bullish order block, fair value gaps, a breakaway gap and a measuring gap. Those labels are his interpretation of the displayed price action, not independently verified market mechanics.
GBP/USD and choosing between overlapping levels
The GBP/USD section is useful for how he chooses between nearly identical references. From 05:20, he describes the pair rallying after reaching the lower quadrant of a premium wick and then delivering up to the high of another wick.
When a candle low and another candle’s opening price occupy roughly the same level, he looks for a different reference outside that overlap rather than counting the two as separate confirmation. He highlights 1.34009 as the low of a discount wick that acts as a premium level on the way up, then discusses 1.33637 alongside an older imbalance, a breaker and a reclaimed fair value gap. At 08:33 he reads candle bodies staying in the upper half of a range while only the wicks probe lower as a sign of bullish intent.
He notes that these are the kinds of setups he looks for during a three-hour New York morning window, 7:00–10:00 a.m. Eastern time (07:18). That is a rule inside his framework, not evidence that a qualifying or profitable setup appears every day.
Nasdaq futures: the December contract
Regular-trading-hours opening range gap
At 09:50, ICT turns to the December NQ E-mini futures contract. He defines the regular-trading-hours opening range gap as the difference between where the previous session settled, at 4:14 p.m. Eastern, and the 9:30 a.m. Eastern opening price. Because the session opened above the prior settlement, he treats the opening price as the gap’s high and the settlement as its low.
He also marks the midnight Eastern opening price (10:24) and a sell-side liquidity pool. In his account, price rallied into a daily imbalance he gives as 25,111.75 and later refers to as “25,110 and 111” (14:37), rejected it, and returned toward the 9:30 opening price.
He explains the move with an analogy: overnight electronic trading had crossed price the regular session had not yet traded, so once regular-hours price entered that space he expected it to travel through the opening-range gap — its upper quadrant, consequent encroachment, lower quadrant and low (11:56).
Time windows and the first 30 minutes
ICT refers to a 7:50–8:10 a.m. Eastern window that he calls a macro, and says price traded into one of his quadrant levels during it (13:13). He then stresses that his opening range uses the first 30 minutes after 9:30, not 15 minutes (13:44).
From there he describes a decline into the low of the morning, a rally back to what the automatic transcript renders as the “first percentage fair value gap”, a push through roughly 25,025, a return to the opening-range-gap high and finally the run into 25,110–25,111. The phrase “first percentage fair value gap” is most likely the transcript’s rendering of “first presented fair value gap” and should be checked against the audio and chart.
Later decline and liquidity
ICT says price later travelled through the opening-range-gap quadrants to about 24,672.5. At 17:28 he corrects himself mid-sentence, saying the level is the upper quadrant of the discount wick rather than the lower quadrant, and repeats the figure as 24,672.5. He then identifies nearly equal lows, with the low on the right slightly higher, as a strong candidate for a run on liquidity (17:47), and describes a sharp rebound and elevated volatility.
He closes with a risk warning: trading volatile conditions without stop losses, on the assumption that you will outperform the average participant, is a way to have your account cleaned out (18:10). Stops do not remove the possibility of loss; the remark is risk commentary.
Recording a review like this in notes
Because the review talks in levels and clock times, a practical way to study it is to save each observation in a digital note or spreadsheet alongside the video link:
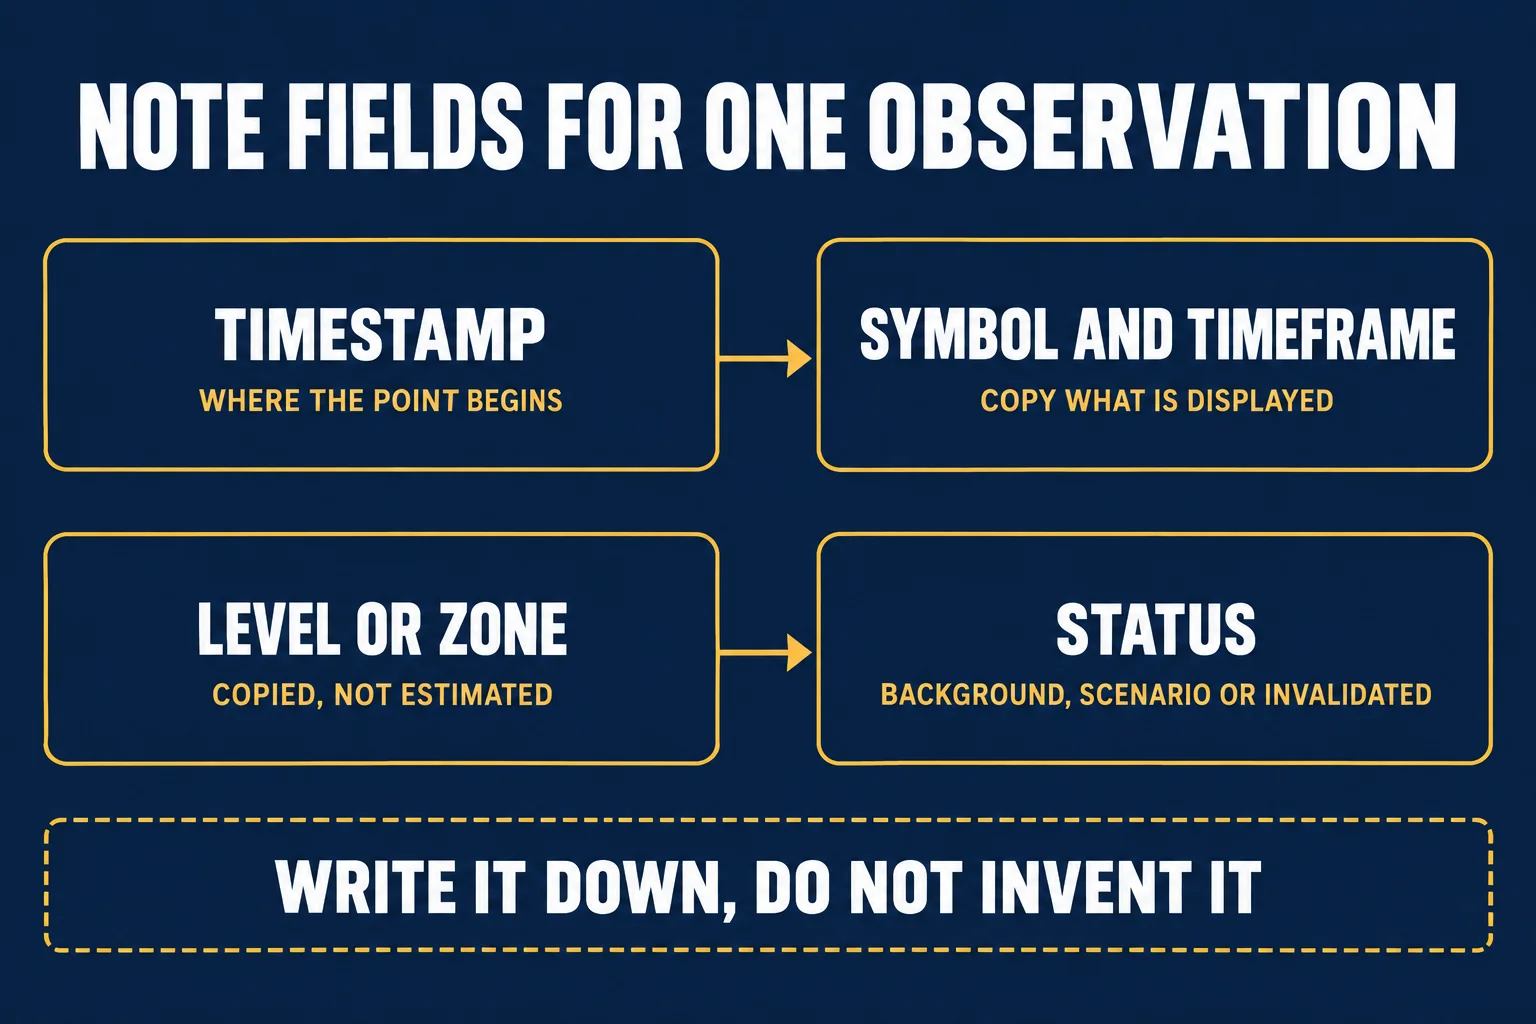
- the timestamp where the point begins, so it can be replayed;
- the symbol and timeframe as displayed;
- the level or zone copied from the chart rather than estimated from memory;
- a status for the point — background, live scenario, or invalidated.
Two limits are worth keeping in the notes. First, the levels above are quoted from an automatic transcript of the audio; the numbers and the ICT terms it renders inconsistently — “SIBI”, “BOSC”/“BISI”, “first percentage fair value gap” — should be checked against the recording and the chart before being reused. Second, the review is a retrospective account of one session by the person whose framework is being explained, and it does not establish fills, results or what happened next.
Watch the original lesson
This article draws on the automatically transcribed English audio of ICT Forex & Futures Market Review \ October 15, 2025 (1,124 seconds, 18:44). The transcript is a source for the speaker’s words, not independent proof of the chart work or of any result.
Watch the original lesson on YouTube
The video cannot be played inside another website: when its embedded player was opened and clicked on 14 September 2026, the player itself reported “Playback on other websites has been disabled by the video owner.” and settled on a “Watch on YouTube” prompt, with no duration and no playback progress reported. That message is the reason no embed is left blank here; the recording itself is available directly on YouTube.
Watch ICT Forex & Futures Market Review \ October 15, 2025 on YouTube ↗
Primary source and further reading
- ICT Forex & Futures Market Review \ October 15, 2025: the primary source. The timestamp links above jump to the passages they summarize.
- The first-party post that links to the recording: attributed to @I_Am_The_ICT, titled “ICT Forex & Futures Market Review \ October 15, 2025”, linking youtu.be/g9BctYx0LaI — the same video identifier as the upload mapped to this article.
- CME Group contract specifications for Nasdaq-100 futures (Micro E-mini MNQ page, read 13 September 2026): the exchange document covering contract unit, tick value and Globex trading hours, including the daily maintenance break. The review itself discusses the December E-mini NQ contract; the page is cited for contract mechanics, not for any level or result. It could not be re-fetched from this host on 14 September 2026.
- BestProps: prop firm drawdown rules by calculation method: this site’s document-based comparison, relevant to the funded-account risk reminders above. It is research, not a ranking, and firms control their current wording.
Method note: captions were not available for this upload, so this article was written from the automatically transcribed English audio of the full recording (local speech-to-text). The transcript renders some terminology inconsistently, and the chart points it references — levels, quadrant markings and the tape-reading details — were not independently visible to the reviewer.
This is independent educational commentary on one dated market review. It is not official ICT material, not a tested trading system, not investment advice, and not evidence that the approach described produces the results the speaker reports.





