Key takeaways
In How To Probe Low Probability RTH Opening Ranges 07/13/2026, ICT frames a news-free Monday that sits between CPI and PPI releases as a low-conviction session.
Read the full summary
In How To Probe Low Probability RTH Opening Ranges 07/13/2026, ICT frames a news-free Monday that sits between CPI and PPI releases as a low-conviction session. He starts with a tentative preference for higher prices but refuses to treat it as a setup: he wants the first 30 minutes to supply information, measures the regular-trading-hours opening-range gap and its midpoint — his consequent encroachment — before the 9:30 a.m. ET open, and then tests the idea with one-contract paper probes and an invalidation level written in advance. When the long probe fails to launch he reverses the hypothesis; when price lingers inside an inefficiency he treats the delay itself as evidence against decisive continuation. His closing point is that the outcome of a trade remains the operator’s responsibility, and the demonstration is about how to probe uncertainty with minimal exposure. Every detail below comes from the recording’s automatically transcribed audio; no fill, price level or result is independently verified.
How we researched this article
BestProps used document-based research from primary firm sources, checked September 14, 2026. The complete source list, scope, limitations, and commercial-state record appear near the end of this article.
In How To Probe Low Probability RTH Opening Ranges 07/13/2026, ICT walks through a paper-trading session in which he is deliberately uncertain about the market’s direction. Rather than presenting the opening bias as settled, he uses small probes, predefined invalidation points, and incoming price action to test competing scenarios.
The central lesson is not that every opening gap should be traded. It is that a trader should recognize when the environment offers relatively weak conviction and respond by reducing exposure—or simply observing. The recording does not independently establish the accuracy or profitability of ICT’s methods, and the transcript cannot verify chart levels, executions, fills, or what happened after the session.
Why ICT considered the session low probability
ICT begins with the week’s economic calendar. He describes Monday as having no scheduled news while CPI and PPI releases, along with central-bank speakers, were expected on Tuesday and Wednesday. He therefore anticipates potentially muted or indecisive Monday price action ahead of the larger scheduled events. He also says he would prefer the later sessions after those releases rather than trying to participate in their initial volatility. This calendar discussion begins near 0:09.
At 3:03, he explains that a news-free session can be quiet, but he does not treat that as a certainty. His working position is explicitly conditional: the market might make a useful morning run, or participants might remain cautious ahead of the next two days’ events.
This uncertainty shapes the entire exercise. ICT does not claim to know the opening direction. He starts with a tentative preference for higher prices but repeatedly states that he wants more information from the first 30 minutes.
Building the initial framework
ICT first reviews the daily chart and then moves through 15-minute and one-minute views. In his terminology, price had moved into a daily “discount” area between two wicks, with a nearby volume imbalance. He marks the midpoint of a prior wick—what he calls “consequent encroachment”—and considers whether the reaction from that area could support a move higher.
He then identifies a partially unfilled new-week opening gap between Friday’s close and Sunday’s open. Around 6:26, ICT says his tentative expectation is for price to explore lower first and eventually work back into that gap toward buy-side liquidity. This is presented as a hypothesis, not a confirmed forecast.
At 9:00, he summarizes the idea: he is interested in longs because he believes the daily chart may have balanced sufficiently, but he does not yet see an entry. That distinction—having a directional idea without treating it as permission to enter—is one of the session’s most useful educational points.
Measuring the RTH opening gap
Before the 9:30 a.m. regular trading hours open, ICT marks Friday’s RTH settlement and prepares a Fibonacci measurement from that level to the forthcoming opening price. He uses the halfway point as the “consequent encroachment” of the RTH opening-range gap. The setup process is shown from approximately 12:30 through 14:54.
ICT prefers to place these levels manually because he wants to inspect the underlying data rather than rely unquestioningly on automation. When asked whether an automated tool changes responsibility for a bad result, he answers that the operator remains responsible. More broadly, this supports a sound educational principle: a tool can calculate a level, but it cannot remove execution risk or responsibility.
The probe, failed launch, and reversal in reasoning
At the open, ICT attempts a one-contract paper-trade probe based on the possibility of a move toward the gap midpoint and nearby buy-side liquidity. He describes keeping the stop below both a recent low and the relevant midpoint area. Because the hypothetical position contains only one contract, it cannot be scaled out; management depends on the stop.
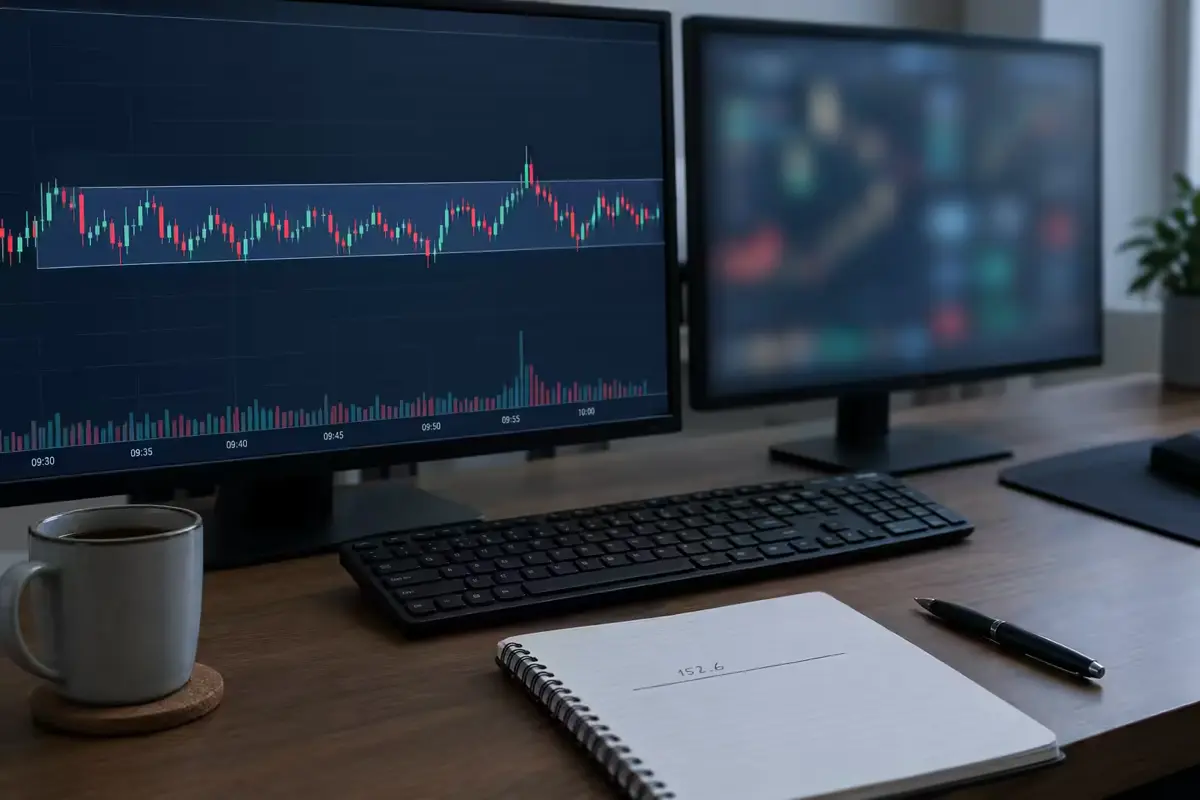
When the long idea does not launch as expected, he does not argue that the market must conform to the original bias. Near 20:24, he shifts to a short paper-trade hypothesis, looking for another move through a nearby low before potentially reassessing a long. Importantly, he warns that a failed long does not automatically make every situation a short. The reversal is tied to the particular levels and behavior he is watching.
At 22:16, ICT explains the purpose of these small probes: he is not fully convinced where the best entry lies, so he is exploring what price appears willing to do. He repeatedly emphasizes that the demonstration is paper trading and cautions against oversized exposure in an uncertain environment.
Using time spent inside an inefficiency as feedback
Later, ICT watches price trade inside an area he labels an inefficiency. His stated expectation is that a genuinely urgent bearish move should pass through it quickly. Beginning around 41:53, he explains that one or two candles—and, at most, roughly three in his preferred formulation—would better support decisive continuation. As more candles remain in the area, he treats the bearish premise as progressively weaker.
By 43:56, he clarifies that this is one of the limited contexts in which he counts candles. It is not presented as a universal signal. He is evaluating whether price is showing the urgency that his setup requires.
When price fails to continue lower as anticipated, ICT interprets that failure as information favoring a return toward an earlier low. The broader lesson is falsification: define what confirming behavior should look like, then reduce confidence when that behavior does not appear.
Practical educational takeaways
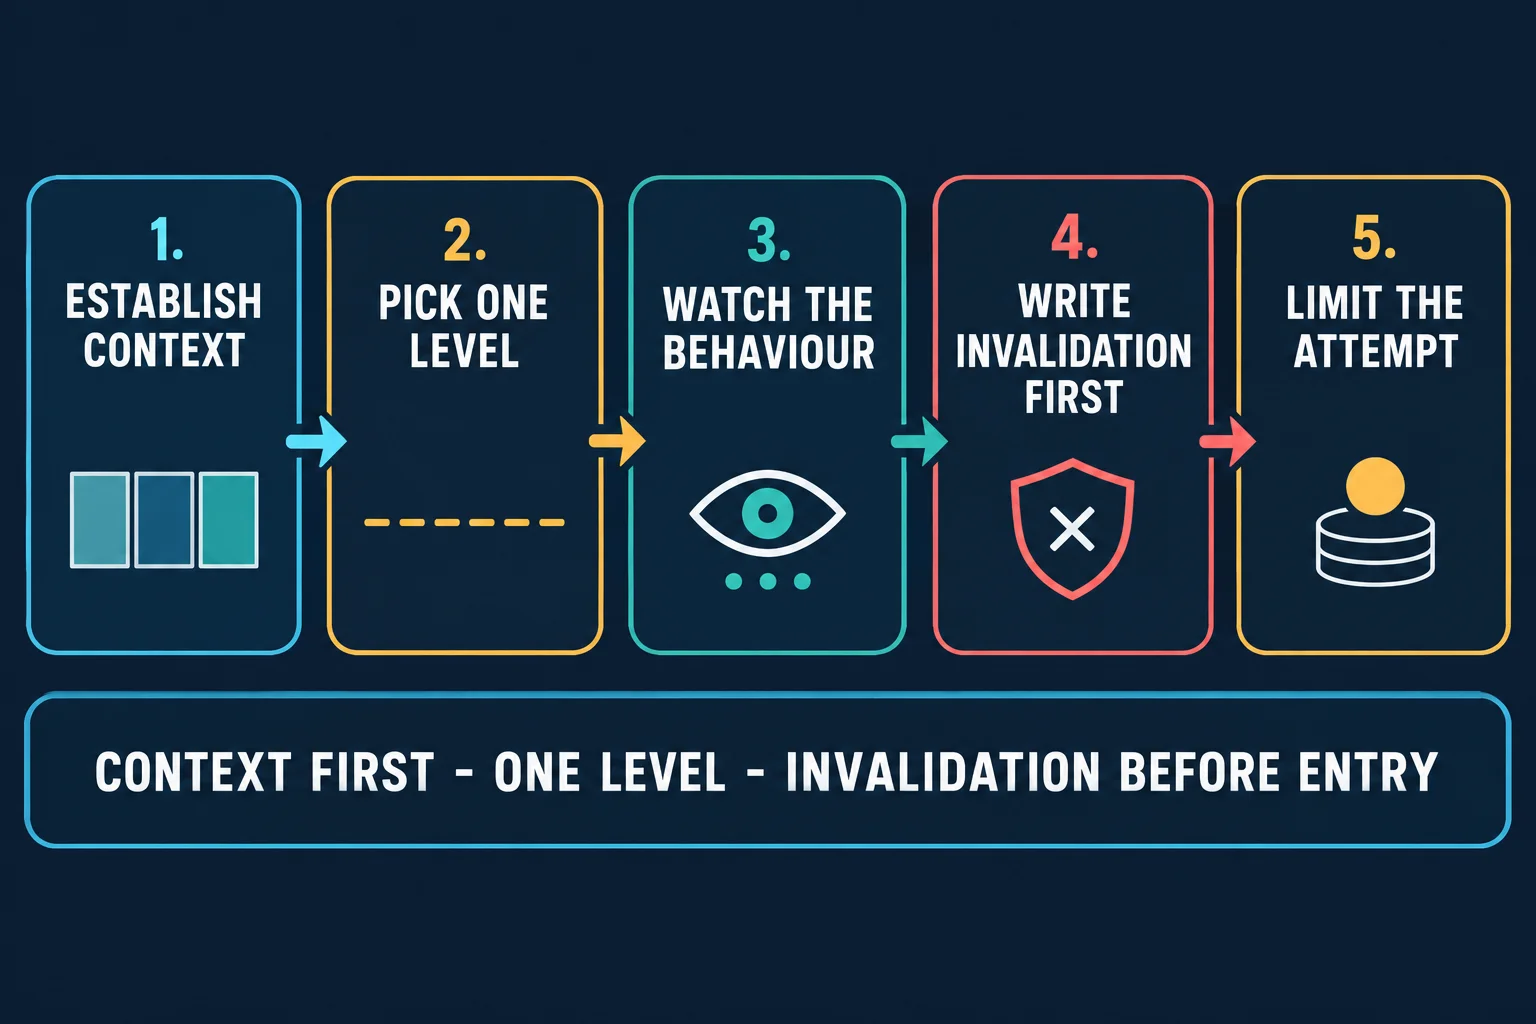
- Start with the event environment. Scheduled releases can influence when a trader chooses to participate, but they do not determine direction.
- Separate bias from entry. A preference for higher or lower prices is not itself a setup.
- Probe uncertainty with minimal exposure—or observe. ICT uses one-contract paper examples to illustrate this principle.
- Define invalidation before entry. Stops and expected price behavior should be established before the result is known.
- Let failed confirmation reduce confidence. Lingering inside an area that should produce immediate displacement can weaken the premise.
- Protect financial and mental capital. ICT’s closing emphasis is that avoiding forced trades can be more valuable than manufacturing an entry for every session.
This video is best understood as a lesson in handling ambiguity at the RTH open. ICT’s market terminology supplies the framework, but the transferable idea is simpler: when the evidence is mixed, use conditional reasoning, controlled risk, and a willingness to abandon the initial thesis.
Related source video: How To Probe Low Probability RTH Opening Ranges 07/13/2026
The recording mapped to this topic is How To Probe Low Probability RTH Opening Ranges 07/13/2026 on the channel The Inner Circle Trader. Its watch page was read on 2026-09-13 and returned that exact title, a stated subscriber count of 2.22M, a runtime of 51:25 and a relative age of two months, so the public recording referenced by this query does exist on that channel. The summary on this page was produced from that recording’s audio, transcribed locally on 2026-09-14 with automatic speech recognition rather than human-verified captions. The transcript is machine-generated, so specialist terms and numbers may be misheard and timestamps are approximate — for example, the transcript repeatedly renders ICT’s term “consequent encroachment” as phrases such as “consequent encouragement”, and this article uses the likely intended term without being able to confirm the chart label on screen. No chart, order ticket or account statement was inspected, so the levels, candle counts and paper-trade sequences are reported as ICT described them and not as verified executions.
Watch the original recording on YouTube
This recording cannot be played inside another website. An embedded player test run on 2026-09-13 from a BestProps page origin returned, from the player itself, “Playback on other websites has been disabled by the video owner”, so no player area is reserved here and no blank embed is left behind. The recording remains available directly on YouTube.
Watch How To Probe Low Probability RTH Opening Ranges on YouTube ↗
Sources for session hours, opening-range context and funded-account limits
Four references support this article: the source recording itself, the chart-platform documentation that defines regular and extended hours, the same vendor’s explanation of when futures sessions open and close, and this site’s documented drawdown comparison. None of them states an outcome for the 07/13/2026 session, and none reports an index price level.
Start with the recording, not a summary of it
The mapped upload How To Probe Low Probability RTH Opening Ranges 07/13/2026 was read directly for this article: the watch page was checked on 2026-09-13 and the full audio was transcribed locally on 2026-09-14.[1] That is why the terminology and the sequence of the session above come from the recording itself rather than from search snippets or third-party recaps. The remaining caveat is the automatic nature of the transcript: a misheard term or number is possible, and nothing visual in the video was verified.
Regular and extended hours are chart settings, not opinions
The distinction this article depends on is documented by the platform rather than by trading commentary. NinjaTrader’s knowledge base states that “Trading Hours Templates dictate the session start and end times for an instrument displayed on a Chart in the NinjaTrader Desktop app”, and that a chart can be set to show “Regular Trading Hours (RTH) instead of Extended Trading Hours (ETH)”. It adds that most default templates display “all available data for their respective instrument”, and that while many futures instruments trade 5 PM to 4 PM Central, Sunday through Friday, “some instrument categories have unique session start and end times determined by their respective exchanges”.[2] A study note about an opening range should therefore name the hours it used, because two traders looking at the same instrument can be looking at different sessions.
Know when the session actually starts and ends
The same vendor’s market-hours explainer states the overall calendar: “Most futures markets are open nearly 24 hours a day, six days a week—from Sunday at 6:00 pm ET to Friday at 5:00 pm ET—with a one-hour daily maintenance break”, and that “Trading hours are set by the exchange that lists the contract”.[3] Its FAQ answer is the practical version: “Can you trade futures 24 hours a day? Nearly.” A regular-hours opening range is a chosen window inside that longer session, which is why the label is a convention rather than something the exchange publishes as a rule.
Quote your own account limits rather than a generic figure
The risk discussion above depends on limits that differ between providers and programmes. This site’s drawdown reference states the distinction plainly: “A static drawdown floor is fixed from the starting balance. A trailing drawdown floor moves up after profits and usually never moves back down.”[4] It also states that “The comparison is not a universal ranking” and that rules can change, so the figure that governs your account is the one in your own provider’s current documents and dashboard.
Sources
- [1] YouTube: How To Probe Low Probability RTH Opening Ranges 07/13/2026 – The Inner Circle Trader (source recording; watch page read 2026-09-13, full audio transcribed locally 2026-09-14)
- [2] NinjaTrader Knowledge Base: Trading Hours Templates – Desktop (RTH and ETH session templates; article updated 8/14/2026, read 2026-09-13)
- [3] NinjaTrader: Futures Trading Hours – Can You Trade Futures 24/7? (Sunday 6:00 pm ET to Friday 5:00 pm ET schedule; published May 15, 2025, read 2026-09-13)
- [4] BestProps: Prop Firm Drawdown Rules by Calculation Method (static versus trailing floors; read 2026-09-13)
Educational commentary only; this article does not provide individualized financial advice or promise trading results. BestProps is not affiliated with The Inner Circle Trader or with NinjaTrader, and no source listed here endorses this article, this site or any setup. The session described above is ICT’s own paper-trading demonstration, reproduced here from an automatic transcript; no fill, price level, win rate or account result was verified, and nothing here demonstrates a tested, repeatable or profitable method. Regular trading hours, extended trading hours, opening range, opening-range gap, midpoint, consequent encroachment, fair value gap, order block and inefficiency are used on this page only as descriptive study terms, and no claim is made that any level repaints less, predicts price or was tested on a live account. Futures and other leveraged products involve substantial risk, and prop-firm rules and account terms can change, so review your provider’s current official documentation before trading.