Key takeaways
ICT W.E.N.T.
Read the full summary
ICT W.E.N.T. Series 5 presents Michael J. Huddleston’s abbreviated top-down Forex framework using monthly, weekly and daily support, resistance, macro trends and the US Dollar Index DXY as the directional barometer, with a falling dollar framed as risk-on and a rising dollar as risk-off. Dollar strength supports short premises in GBP/USD and EUR/USD, refined through London timing, price structure and session-specific counter-moves. The principal London Open Kill Zone runs from two a.m. to four a.m. New York time, with a broader one a.m. to five a.m. window. A bearish Judas Swing is an initial rally above the New York midnight open before expansion lower, while Optimal Trade Entry uses a 62% to 79% retracement zone. Power of Three organizes a bearish day as open, initial rally and expansion lower, and Turtle Soup seeks rejection after a false breakout above prior or approximately equal highs. The example uses a 30-pip stop with position sizing, suggests 0.25% demo-account risk for beginners and avoids FOMC and non-farm payroll days. Exit references include prior intraday extremes, 127%, 162% and 200% Fibonacci extensions, average daily range, New York trading and the London-close window from ten a.m. to eleven a.m. New York time. A New York continuation variant uses six a.m. New York time as its reference. Daily-chart filters use 18-period and 40-period moving averages for swing context and 9-period and 18-period averages for intraday bias, with moving averages removed below the four-hour chart. ICT classifies price into consolidation, trend and reversal, supplements higher-time-frame analysis with COT data and Moore seasonal tendencies, and stresses months of chart study, correct time-zone conversion and predefined risk and exits rather than treating any pattern or performance claim as guaranteed.
How we researched this article
BestProps used document-based research from primary firm sources, checked September 25, 2026. The complete source list, scope, limitations, and commercial-state record appear near the end of this article.
ICT W.E.N.T. Series 5 of 5 concludes Michael J. Huddleston’s review of “what every new and/or aspiring Forex trader wants to know.” Although the video was uploaded on November 26, 2017, the presentation identifies its chart discussion as taking place on August 6, 2014. It is an abbreviated recap of ICT’s broader material rather than a complete course.
Primary source: Watch ICT W.E.N.T. Series 5 of 5 on YouTube.
ICT Higher Time Frame Trade Context
ICT opens by stressing that a few videos cannot substitute for sustained chart study. He says his framework begins with support and resistance plus macro trends on monthly, weekly and daily charts (2:14). Lower-time-frame setups are then considered within that broader directional premise.
At 5:05, he introduces “risk-on” and “risk-off.” In the simplified relationship presented in this lesson, a falling US dollar corresponds to risk-on behavior, while a rising dollar corresponds to risk-off behavior and pressure on foreign currencies, equities and commodities. ICT describes the dollar as his market barometer, particularly because the lesson focuses on dollar-denominated Forex majors.
This should be read as ICT’s analytical model, not an invariant market law. Cross-asset relationships can vary over time, and the transcript does not independently test the claimed correlation or accuracy.
ICT Dollar Context for Currency Trades
ICT’s seesaw analogy appears at 11:34: if the dollar strengthens, he expects foreign currencies quoted ahead of USD–such as GBP/USD and EUR/USD–to weaken. In the chart example described verbally, he interprets the dollar as returning to expected support. That leads him to look for short scenarios in GBP/USD, known as “cable,” and EUR/USD, which he calls “fiber.”
The process presented is hierarchical:
- Assess dollar direction on higher time frames.
- Determine whether that implies strength or weakness in the selected currency pair.
- Wait for a lower-time-frame setup aligned with that premise.
- Use session timing and price structure to refine the idea.
The recording describes charts that are not visible in the transcript, so exact levels, candle formations and historical outcomes cannot be verified from the captions alone.
ICT London Session Timing and OTE Trades
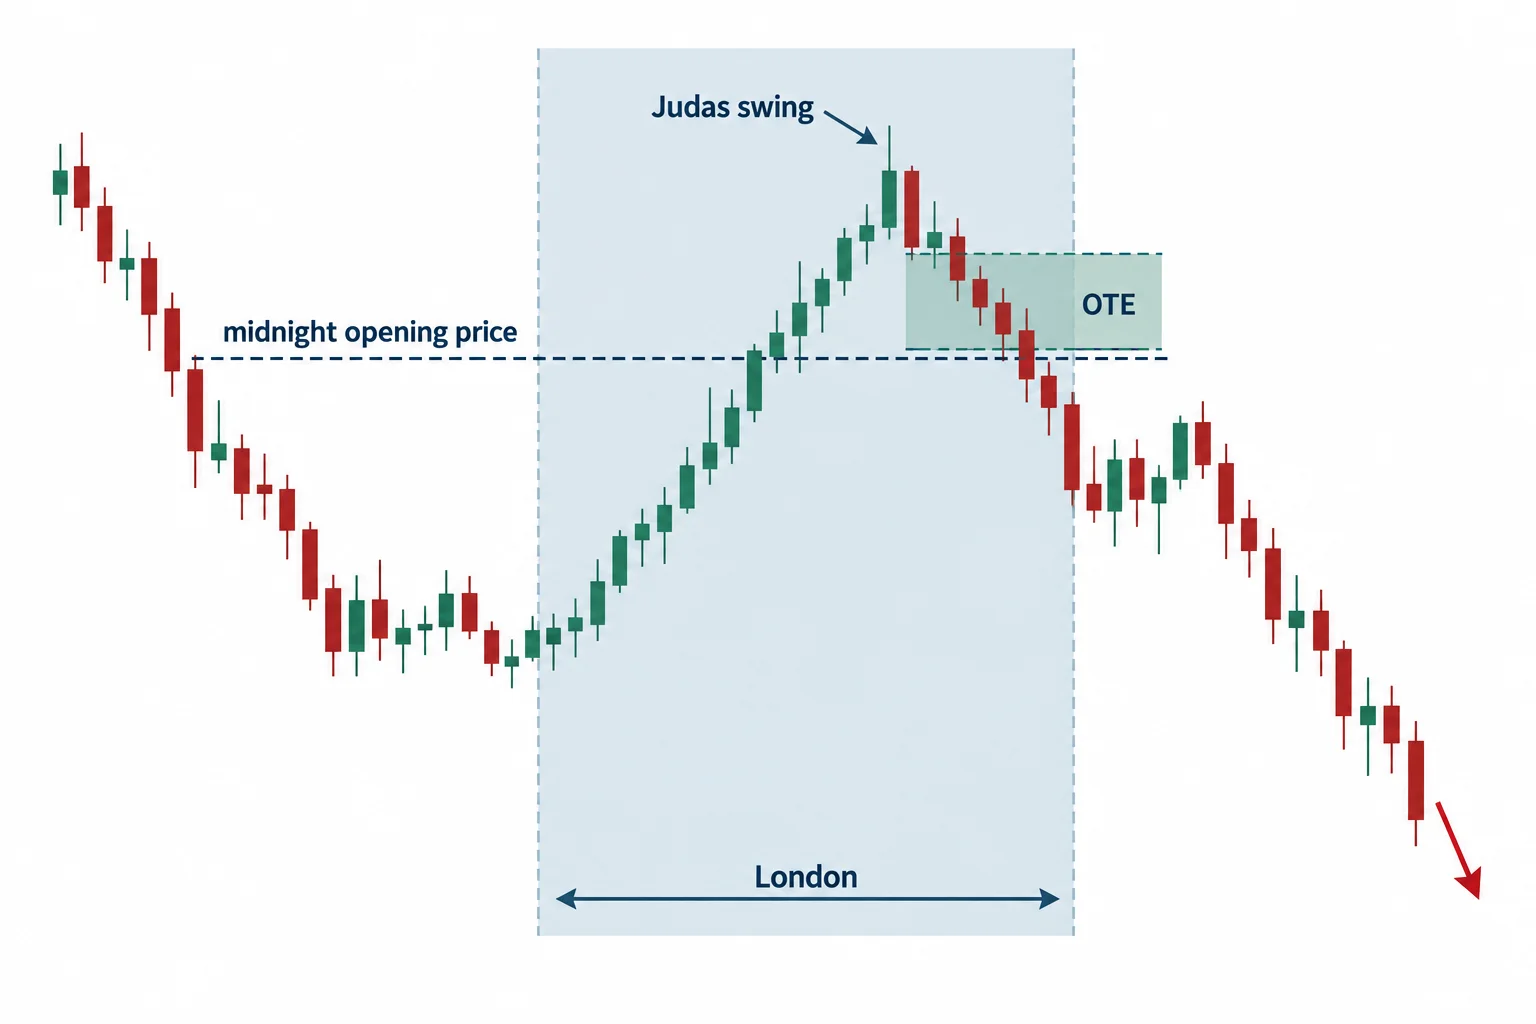
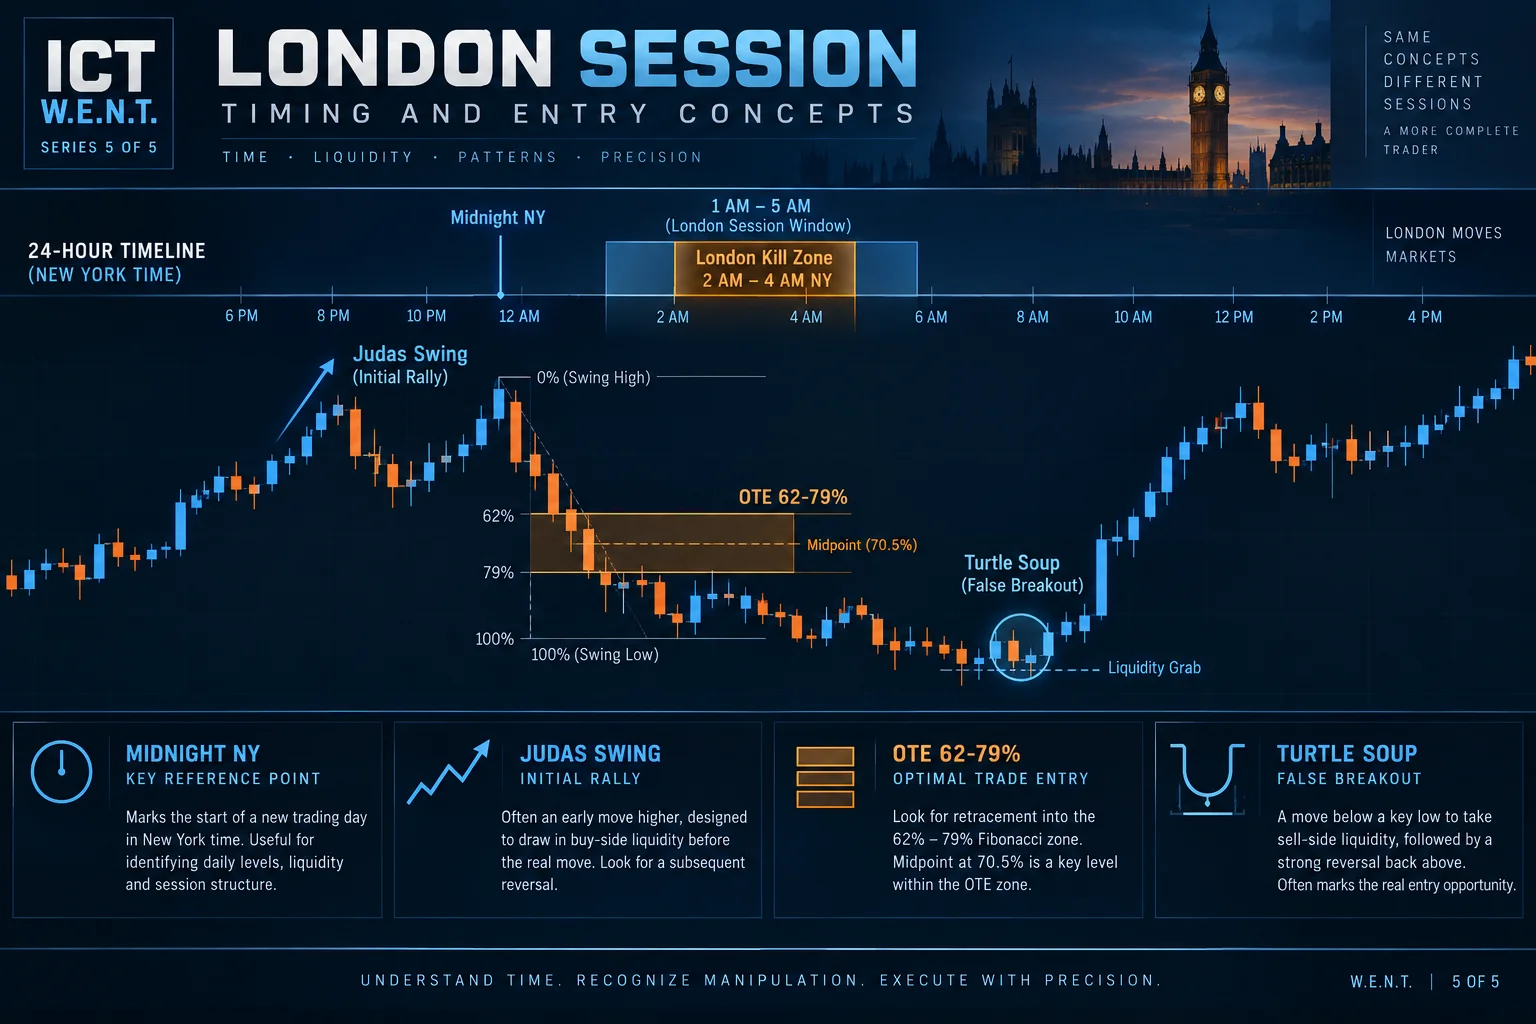
Beginning around 22:00, ICT focuses on the London session. He places his principal London Open “kill zone” between 2:00 a.m. and 4:00 a.m. New York time, while allowing a broader window from roughly 1:00 a.m. to 5:00 a.m. He repeatedly advises viewers to convert New York time correctly rather than copying chart-clock labels without adjustment.
For a bearish day, his preferred sequence is an initial rally after the New York midnight reference point followed by a decline. He calls that counter-directional opening move a “Judas swing.” Rather than chasing an early drop, he looks for a rally above the midnight opening price that could provide a sell setup.
At 27:00, ICT adds his Optimal Trade Entry, or OTE. In this presentation, it is a retracement zone from 62% through 79%, with an ideal area near the midpoint. He combines that zone with the higher-time-frame premise and London timing; the retracement by itself is not presented as the entire method.
ICT Power of Three
The “Power of Three” discussion starts near 30:10. For the bearish case, ICT describes an open, an initial rally and then range expansion lower. He expects the day’s high to form first in or around London, followed by a decline whose opposite extreme may develop during New York or the period he labels London close.
This is a model for organizing intraday observations, not proof that every daily range follows the same sequence. ICT explicitly acknowledges failed setups and losing days later in the lesson.
ICT Trade Context for False Breakouts and Liquidity
At 57:30, ICT introduces “Turtle Soup” as a false-breakout pattern. In a bearish setting, he looks for price to move above an earlier high–where he believes stops and breakout orders may be concentrated–and then reject that level.
He later applies the same logic to approximately equal highs in EUR/USD. The lesson contrasts this interpretation with buying a conventional bullish breakout. Statements about dealer intent, market-maker behavior and stop locations are ICT’s interpretations; the transcript provides no order-book evidence proving who traded or why.
ICT Session Risk and Trade Management
ICT discusses a standardized 30-pip stop in the example at 49:40, while repeatedly emphasizing position sizing, not treating 30 pips as universally safe. For beginners, he suggests studying with a demo account and illustrates risk of one-quarter of one percent (46:14). He also says he avoids trading major announcement days such as FOMC and non-farm payroll within this framework (54:21).
For exits, the presentation combines time and price. Potential references include:
- Prior intraday lows or highs.
- Fibonacci extensions at 127%, 162% and 200% from a selected swing (79:00).
- Average daily range estimates.
- The New York session or ICT’s London-close window (10:00-11:00 a.m. New York time, 76:28).
At 119:30, he explains a New York-session variant using 6:00 a.m. New York time, or 11:00 GMT in the recording’s seasonal alignment, as a reference. In an established downtrend, he looks for a rally after that marker as a possible continuation setup. Time-zone and daylight-saving differences must be checked rather than assuming those GMT conversions are permanent.
ICT Trade Context With Moving Average Filters
Later in the lesson, ICT adds moving averages on the daily chart as trend filters. For swing context he uses an 18-period and 40-period combination, looking for a crossover and “stacking” to confirm institutional sponsorship (96:23). For intraday directional bias he applies a 9-period and 18-period combination on the daily chart (98:16). He explicitly states that moving averages are removed below the four-hour chart because the lower-time-frame entry is supposed to follow, rather than redefine, the higher-time-frame premise (105:02).
ICT Trade Framework for Trends and Reversals
In the closing framework, ICT reduces price behavior to three primary profiles: consolidation (range bound), trend and reversal. He states that markets move from consolidation into trend and eventually reverse at support or resistance of greater measure (126:36). He encourages studying how price moves from a range into expansion and eventually reverses, noting that inside consolidation is where “smart money accumulation is being done” (128:13).
ICT Trade Context Using Seasonality and COT Data
ICT briefly mentions seasonal tendencies and Commitments of Traders (COT) data as inputs to longer-term analysis. He references the work of “Moore” (M-O-O-R-E) for seasonal tendency graphs across commodities, currencies, oil, gold and silver (128:31). He notes that applying seasonal tendencies to higher time frames helps identify when buying or selling programs are likely to commence (128:42).
ICT Risk and Trade Takeaways
The most useful way to read this lesson is as a top-down checklist: establish context, select one direction, wait for a session-specific counter-move, require a recognizable setup, define risk and identify exits before acting. ICT urges viewers to study repeated examples for months rather than expecting immediate competence.
The video also contains strong claims about accuracy, profitability and the uniqueness of ICT’s methods. Those are the speaker’s claims and are not validated by the transcript. No chart narration, isolated example or historical pattern guarantees a future result. This summary is educational and is not investment advice.
ICT Trade Framework Resources
- ICT W.E.N.T. Full Series Playlist – The complete “What Every New Trader” series on YouTube.
- CFTC Commitments of Traders Reports – Official source for COT data referenced in the lesson.
- U.S. Dollar Index (DXY) Chart – ICT’s primary barometer for risk-on/risk-off assessment.
- Moore Research Center Seasonal Tendencies – Seasonal tendency data source cited by ICT in the lesson (unofficial, not independently tested by BestProps).