Key takeaways
ICT reviews GBP/USD and EUR/USD on daily and 15-minute charts, emphasizing that equilibrium analysis measures the full wick-to-wick range and marks its 50% midpoint, while entry-oriented Fibonacci analysis uses candle opens and closes near swing points.
Read the full summary
ICT reviews GBP/USD and EUR/USD on daily and 15-minute charts, emphasizing that equilibrium analysis measures the full wick-to-wick range and marks its 50% midpoint, while entry-oriented Fibonacci analysis uses candle opens and closes near swing points. For GBP/USD, he frames an untidy market maker sell model and aligns a Fibonacci midpoint with the consolidation equilibrium to project market symmetry, which retrospectively matched the day’s low. For EUR/USD, he interprets price near the range high as overbought without RSI, stochastic or MACD, identifies a lower high and optimal trade entry using candle bodies, and reports a small short with a 35-pip stop under his Power of Three framework, targeting movement below a prior low where he expected sell stops. He also marks the midnight New York open and a rally he calls a Judas swing. ICT generally trades lightly or avoids normal size until roughly the third week of January because he considers the first two weeks less predictable after the holidays, though substantial moves can still occur. The practical lesson is to journal the exact range, midpoint, wick or body measurement rule, projection method and subsequent outcome without treating retrospective precision, seasonal caution or algorithmic price-delivery claims as independently proven.
How we researched this article
BestProps used document-based research from primary firm sources, checked September 25, 2026. The complete source list, scope, limitations, and commercial-state record appear near the end of this article.
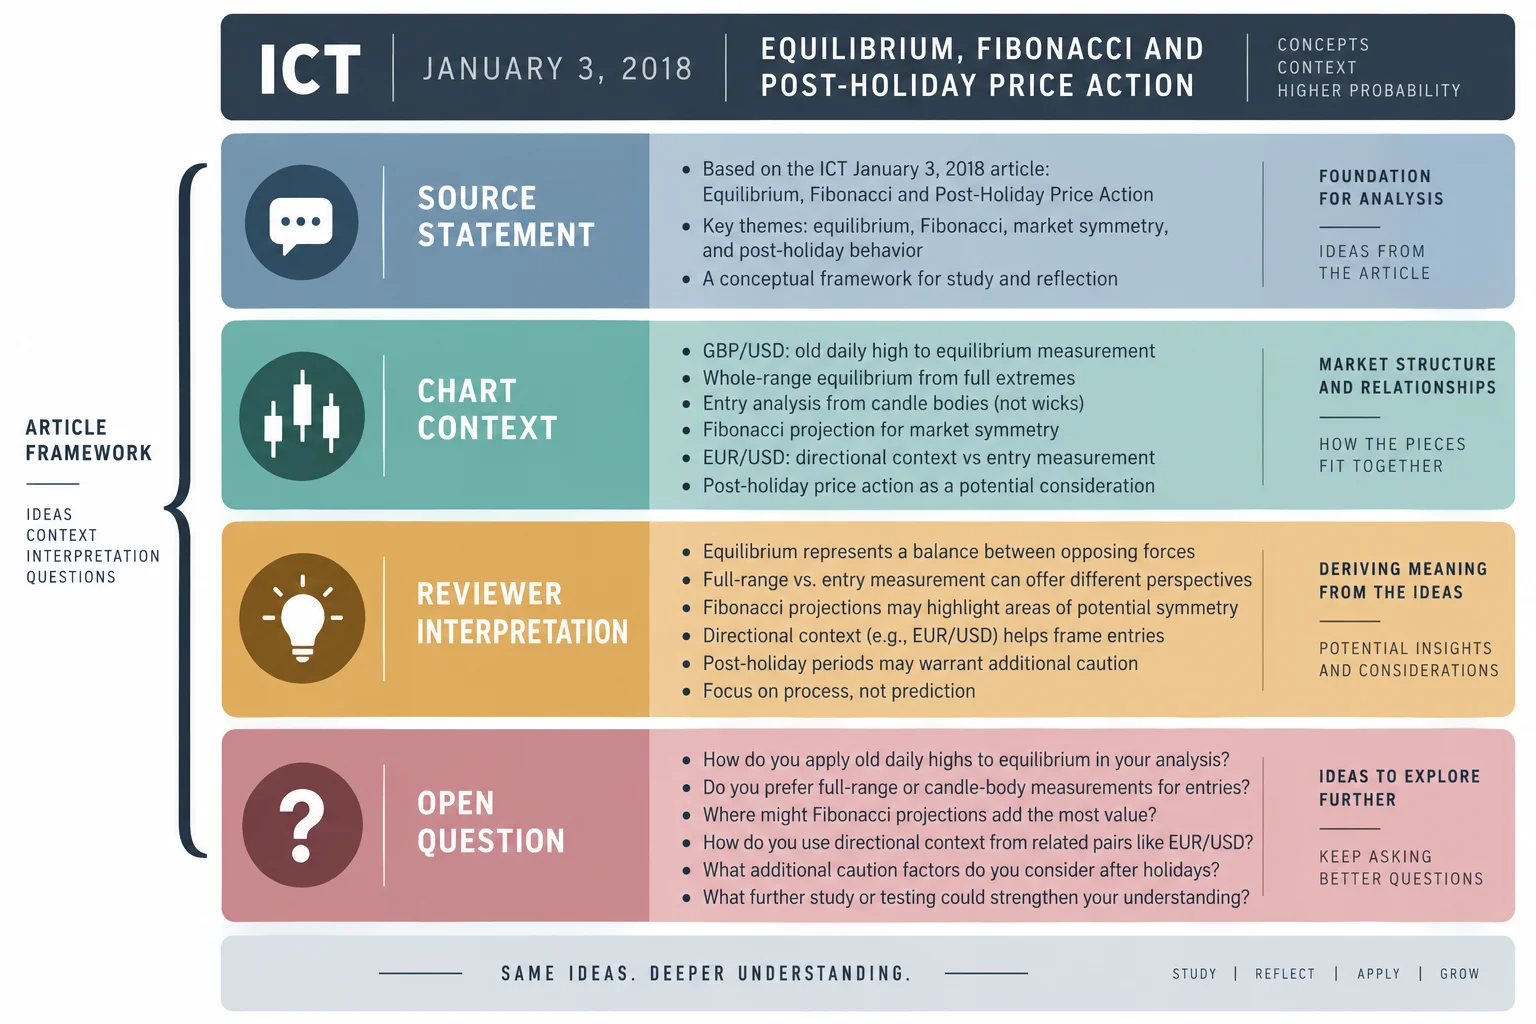
The video was uploaded on January 4, 2018. During the recording, ICT says it is January 3 and shortly after 7 p.m. in his US Eastern time zone. Because the source consists of automatically generated captions, some specialized terminology may be imperfectly transcribed.
ICT January Caution and Post-Holiday Price Action
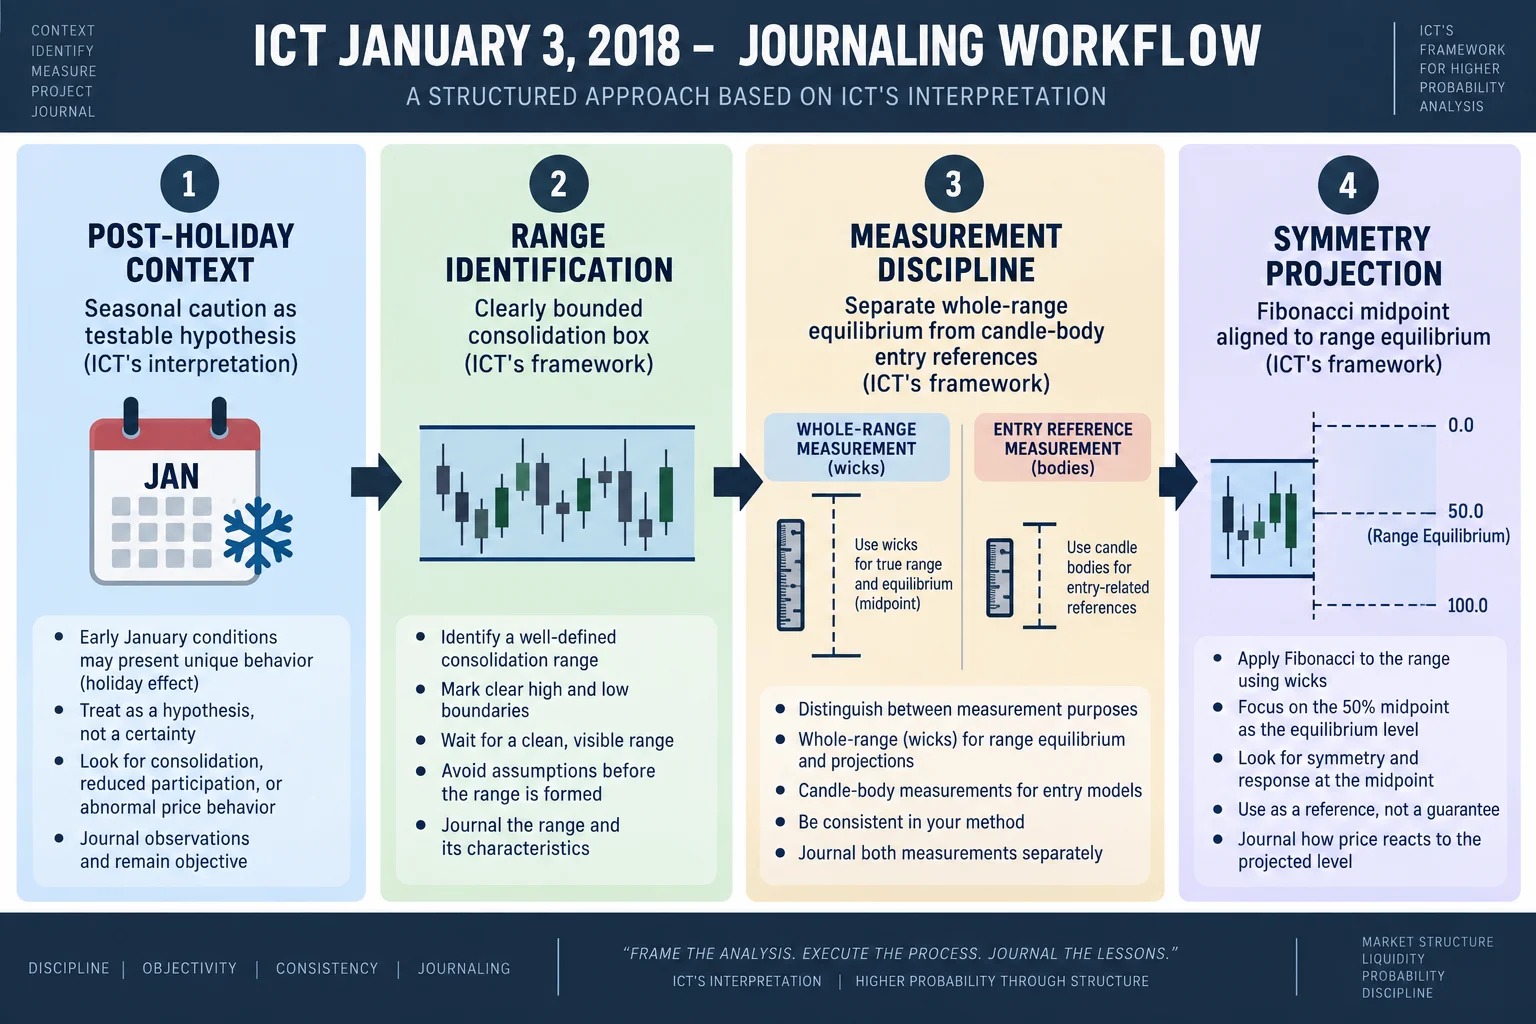
ICT begins by saying that he normally remains lightly involved, or does not trade at his usual size, until approximately the third week of January. At 0:43, he describes reviewing completed daily price action, marking up charts and using the exercise for journaling even when he is not actively trading.
He attributes this caution to what he calls a post-holiday rut. In his personal experience, price action during the first two weeks of January can be less predictable or precise. This is presented as ICT’s discretionary market interpretation, not as a statistically demonstrated seasonal rule. He also acknowledges that markets can still make substantial moves during this period.
ICT says he did not trade the GBP/USD example shown in the first part of the lesson. He reports taking a very small EUR/USD position, but the transcript alone cannot independently establish the fill, account details, result or any later market outcome.
ICT GBP/USD Price Action and Equilibrium
At 2:38, ICT turns to a daily GBP/USD chart, commonly called “cable.” He focuses on price moving through an earlier daily high. He explains that fresh-year sentiment may reverse, be challenged or undergo a deep retracement before an existing direction resumes.
On the 15-minute chart, beginning around 3:53, ICT labels the movement a somewhat untidy “market maker sell model.” His narration describes a sequence of consolidation, movement above the range, a return toward it, another rise and then a decline beneath the original consolidation. These labels belong to ICT’s framework and should not be treated as independently verified descriptions of market participants’ actions.
Measuring the Full Range for Equilibrium
The main technical distinction begins at 6:38. ICT defines a consolidation as a visibly bounded, box-like range. To locate its equilibrium, he measures from the range’s lowest low to its highest high and uses the 50% midpoint.
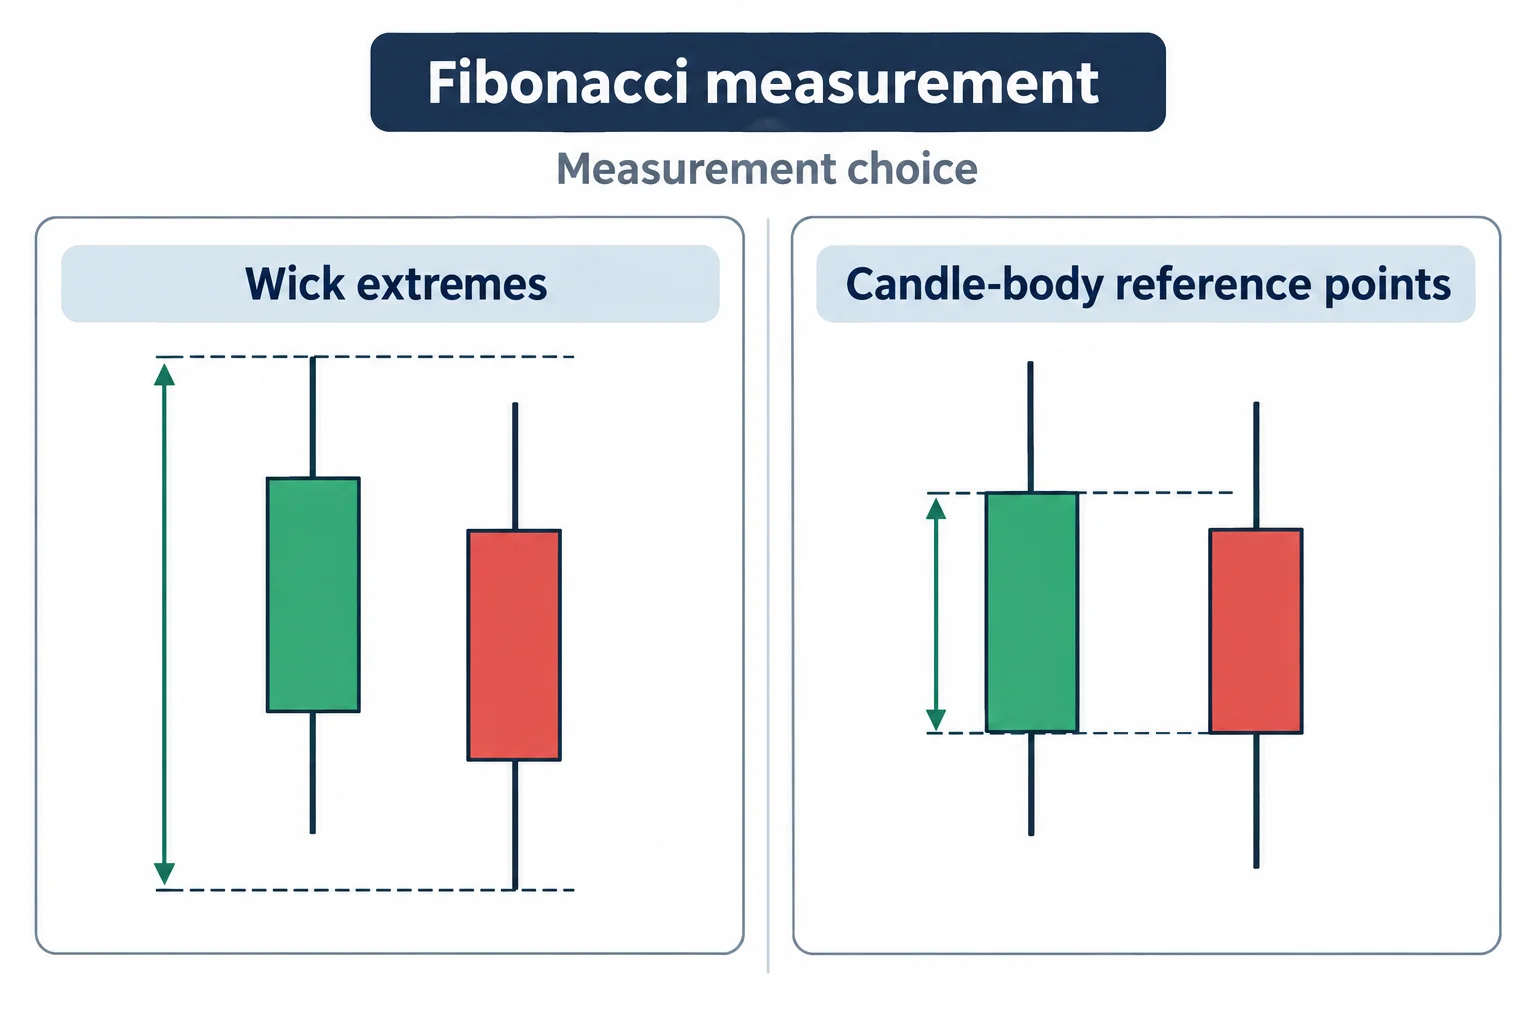
He emphasizes that this whole-range measurement is different from his entry-oriented Fibonacci procedure:
- Equilibrium or range analysis: ICT uses the full extremes, including the wicks, to measure the highest high and lowest low.
- Entry analysis: He says he instead references candle opens and closes near swing points, focusing on candle bodies rather than the full wick-to-wick range.
This distinction is restated clearly at 10:04. It matters because applying one measurement method where ICT intends the other would produce different levels.
Projecting Fibonacci Price Symmetry
ICT then moves a Fibonacci measurement until its midpoint aligns with the previously marked equilibrium of the consolidation. At 11:30, he describes this as a way to project “market symmetry.” According to his reading of the displayed chart, the projection aligned closely with that day’s low.
ICT connects this example to broader claims about algorithmic price delivery. Those claims are his own market theory; this single retrospective chart discussion does not test or prove that prices are predetermined. A more general educational takeaway is narrower: traders can document in advance exactly which range, midpoint and projection method they are studying, then evaluate the method across a larger sample without changing definitions afterward.
ICT EUR/USD Price Action and Fibonacci Entries
At 13:53, ICT moves to EUR/USD. He says the pair had risen above an older high but had not reached another nearby high. Rather than expecting that remaining high to be taken, he viewed EUR/USD as relatively overbought within the range and looked for a decline. He did not rely on RSI, stochastic, MACD or another oscillator; “overbought” here refers to location near the upper part of his chosen price range.
On the 15-minute chart, ICT uses candle-body reference points to discuss an “optimal trade entry.” Starting around 16:16, he describes a lower-high structure and says his short entry occurred while price was rising. He also reports using a 35-pip stop and characterizes the position as an early-entry application of his Power of Three framework.
Later, he identifies the midnight New York opening price, a rally he calls a “Judas swing,” and a retracement level before the decline. He says his objective involved movement beneath a prior low, where he expected sell stops to rest. These are retrospective explanations of ICT’s framework, not independently confirmed order-flow data.
ICT Price Action Chart Journaling
ICT Equilibrium and Fibonacci Takeaways
- Keep post-session chart review separate from claims about what could have been traded in real time.
- Define whether a Fibonacci measurement uses full wick extremes or candle-body reference points.
- Mark the midpoint of a clearly defined range before evaluating any claimed symmetry.
- Record seasonal caution as a hypothesis to test, not a universal market law.
- A precise historical example does not establish reliability across other sessions or instruments.
ICT closes by reiterating that the two examples appeared relatively precise to him, while warning that post-holiday markets can lack symmetry. The lasting value of the lesson is its demonstration of a structured chart-journaling process: identify the range, document the chosen measurement rules and review whether subsequent movement matched the original framework. This summary is educational commentary and not investment advice.
Watch the ICT January 2018 Session
ICT January 2018 Resources
- ICT January 03, 2018 (primary video) Full Inner Circle Trader session on YouTube.
- Fibonacci retracement (Investopedia) Background on the Fibonacci measurement tool discussed.
- BIS foreign exchange statistics Official market structure data for context on forex liquidity.
- SEC forex trading risk alert Regulatory perspective on forex market risks mentioned in the session.