Key takeaways
ICT’s Market Maker Sell Model, explained in The Inner Circle Trader video at https://www.youtube.com/watch?v=JmcjMJQPFxs, is a repeating fractal sequence of original consolidation, rally above prior highs into a reversal area, lower-risk selling opportunities, redistribution, and decline toward or through the initial range and sell-side liquidity below earlier lows.
Read the full summary
ICT’s Market Maker Sell Model, explained in The Inner Circle Trader video at https://www.youtube.com/watch?v=JmcjMJQPFxs, is a repeating fractal sequence of original consolidation, rally above prior highs into a reversal area, lower-risk selling opportunities, redistribution, and decline toward or through the initial range and sell-side liquidity below earlier lows. ICT defines buy-side liquidity as breakout orders and short-position stops above old highs, frames rallies as algorithmic repricing rather than buying pressure, and applies the model to a 90-minute EUR/USD chart featuring an old high, an August 17 reference level, a smart money reversal, fair value gaps, order blocks, low-resistance and high-resistance liquidity runs, and the curve at the model’s extreme. Unlike Wyckoff accumulation and distribution, ICT says his framework targets the original consolidation or liquidity beneath it, organizes price around liquidity above highs and below lows, and uses breakers, order blocks, fair value gaps, mean thresholds, and other price-delivery concepts as anticipatory signatures. The article treats claims about IPDA, central banks, algorithmic control, originality, precision, and forecasts as ICT’s unverified interpretations, stresses that hindsight recognition is easier than prediction, and recommends testing definitions on unseen data with predefined risk rather than treating chart annotations as an executable strategy.
How we researched this article
BestProps used document-based research from primary firm sources, checked September 25, 2026. The complete source list, scope, limitations, and commercial-state record appear near the end of this article.
ICT Sell Model Price Action Lesson
In ICT Forex Price Action Lesson – IPDA Vs. Wyckoff Theory, ICT contrasts his “market maker sell model” with Wyckoff-style accumulation and distribution. His central argument is that the two frameworks may both depict a market rising and then declining, but they assign different meanings to the movement and use different reference points.
The lesson is partly instructional and partly a defense of authorship. Claims about originality, central-bank behavior, algorithmic price control, precision, and prior forecasts are ICT’s own market interpretations. The transcript alone cannot independently verify them.
ICT Market Maker Sell Model
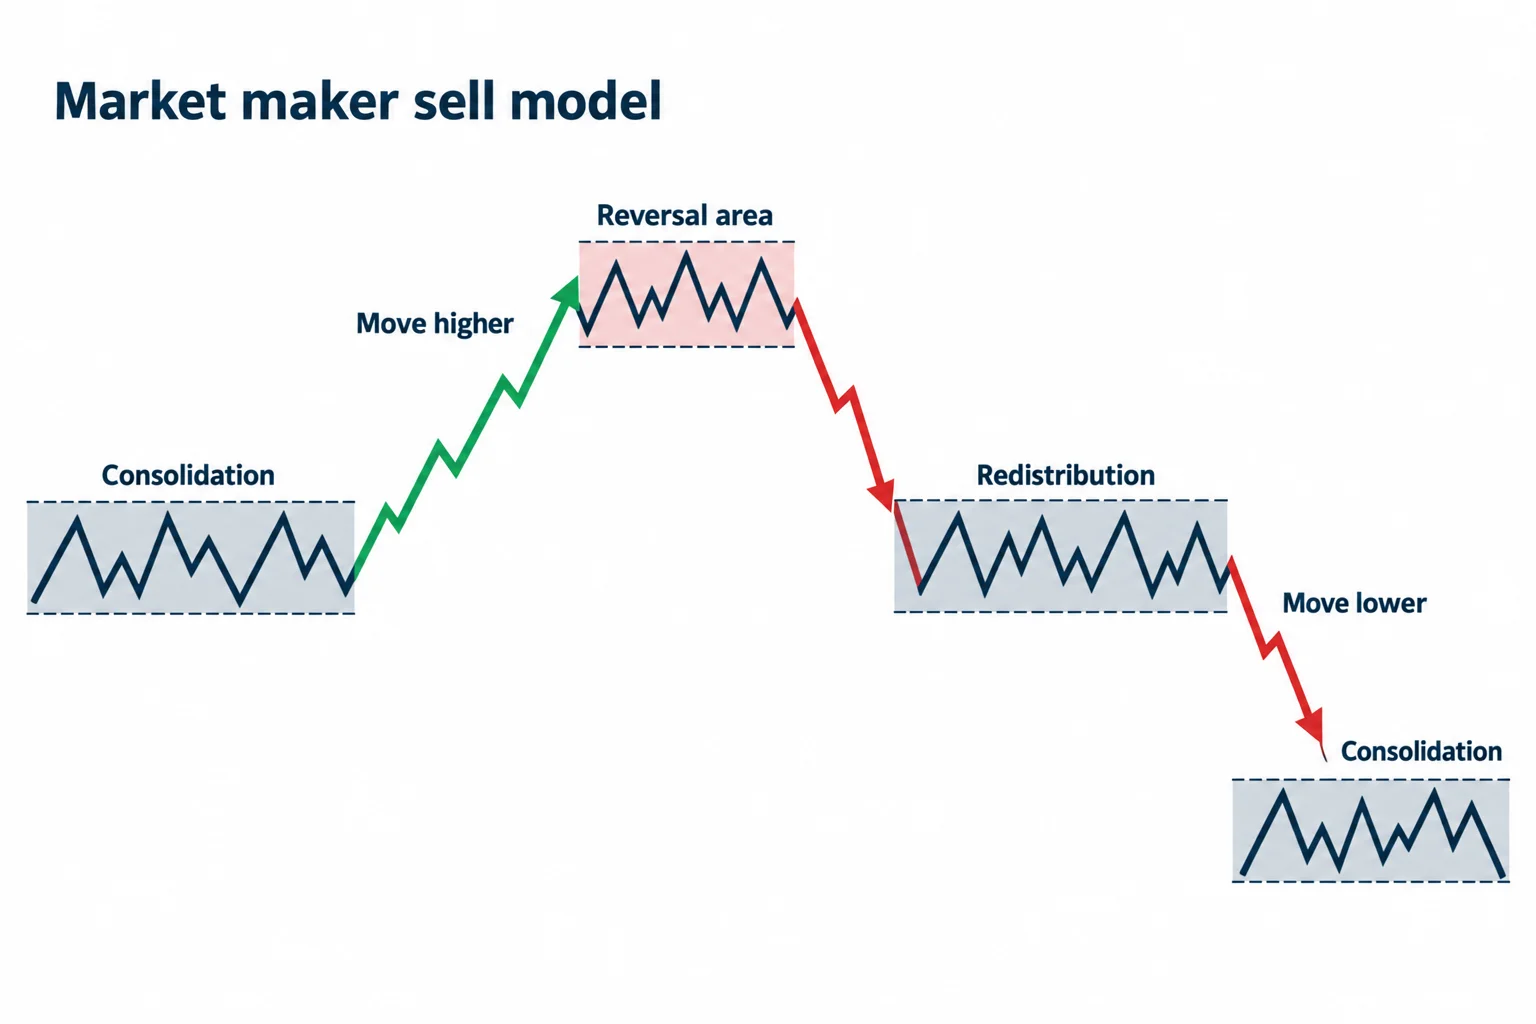
ICT introduces the model as a repeating price pattern consisting of an original consolidation, a move higher, a reversal area, lower-risk selling opportunities, redistribution, and a decline toward or through the initial consolidation. He calls it a fractal because he believes the broad sequence can appear on multiple time frames. A reversed version is described as the market maker buy model.
The initial explanation begins at 0:53. ICT later reduces the general sequence to three steps: consolidation, movement to a level expected to attract selling, and subsequent movement lower. He also cautions that recognizing a completed pattern in hindsight is not equivalent to anticipating or trading it successfully.
Sell Model Liquidity Above Highs and Below Lows
Within ICT’s terminology, “buy-side liquidity” refers to orders expected above an old high, including breakout purchases and buy stops protecting short positions. “Sell-side liquidity” refers to orders expected below old lows. In the sell model, he focuses first on a run above prior highs and then on a decline toward liquidity below earlier lows.
At 9:22, ICT directs attention beneath the lows of the original consolidation, describing that area as a later target. This is the model’s key directional relationship: the rally is interpreted as drawing price toward orders above a high, while the subsequent decline works back toward the original consolidation and lower liquidity.
ICT Model Repricing Instead of Buying Pressure
A major theme begins at 11:49. ICT rejects the conventional description that buying pressure alone drives a rally. Instead, he characterizes the move as “repricing,” with buyers transacting at progressively higher offered prices.
He extends this interpretation to central banks and an interbank price-delivery mechanism. According to ICT, price is delivered according to time and price, with recurring operations activated under particular conditions. Near 59:19, the transcript renders the acronym as “IPTA,” followed by “Interbank Price Delivery Algorithm.” Given the video title and the phrase itself, this likely refers to IPDA, but the automated transcription is ambiguous.
ICT Sell Model EUR/USD Example
At 36:43, ICT turns to what he identifies as a 90-minute EUR/USD chart. He says the interval was selected for visual clarity rather than because 90 minutes has special analytical significance.
He describes price moving above an old high and then declining. In his reading, orders above that high supplied counterparties for short positions. He labels the upper region a “smart money reversal” and interprets the subsequent decline as part of the market maker sell model.
The chart discussion introduces several ICT terms:
- Low-resistance liquidity run: a comparatively quick move from inception to target.
- High-resistance liquidity run: a move that takes more time to reach its objective.
- Fair value gap: an area ICT associates with an imbalance in price delivery.
- Order block: a candle or price area used in his framework as a potential reference for repricing.
- The curve: the highest point of a sell model or the lowest point of a buy model, dividing the two sides of the pattern.
From 46:30, he walks through the old high, an August 17 reference level, the reversal area, and a decline toward the original consolidation. Because the transcript contains no chart image, exact prices, candle boundaries, fills, or risk parameters cannot be reconstructed reliably from the narration alone.
Primary source video
ICT Forex Price Action Lesson – IPDA Vs. Wyckoff Theory The Inner Circle Trader, uploaded 2020-08-21, length 1h 46m 9s.
Playback on third-party sites is disabled by the video owner, so the recording is shown here as a watch card. Open the link on YouTube to follow the original lesson alongside this article.
ICT Sell Model vs Wyckoff Theory
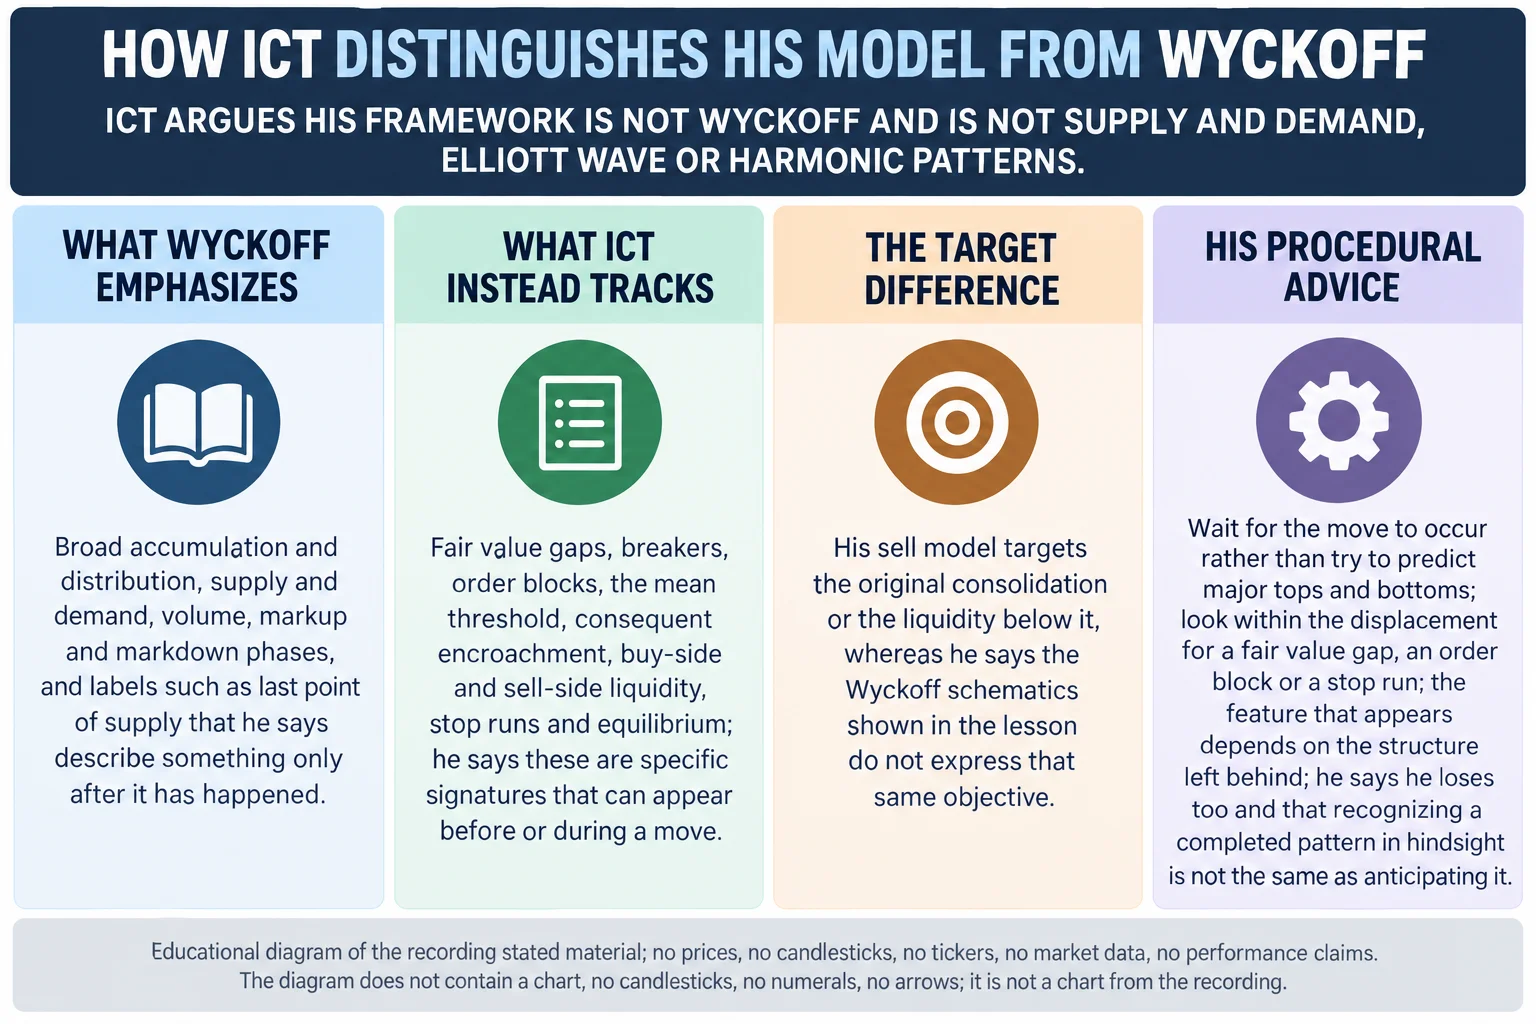
ICT begins the direct Wyckoff comparison around 1:10:54. He acknowledges that Wyckoff schematics also include accumulation, distribution, markup, and markdown. However, he argues that a generic rise followed by a decline is not enough to make the frameworks identical.
His claimed distinctions are:
- The sell model targets the original consolidation or liquidity beneath it, while he says the Wyckoff schematics shown do not express that same target.
- ICT organizes the model around liquidity above highs and below lows rather than around supply, demand, and volume.
- His framework uses fair value gaps, breakers, order blocks, mean thresholds, and related price-delivery terms that he says are absent from Wyckoff.
- He presents those features as signatures to anticipate, whereas he characterizes Wyckoff labels such as “last point of supply” as largely descriptive after the move.
At 1:14:04, ICT discusses a Wyckoff accumulation schematic and argues that it should not be equated with his market maker buy model. Later, at 1:22:48, he reviews a distribution schematic and focuses on the absence of his preferred entry concepts.
ICT Sell Model Learning Takeaways
The most useful way to study this lesson is as a vocabulary and model-comparison exercise, not as proof that one framework predicts markets. Identify the original consolidation, prior highs and lows, the proposed reversal area, and the claimed return toward the initial range. Then separate what is visible on a chart from the causal explanation assigned to it.
ICT himself notes that trading is not perfect, that losses occur, and that hindsight recognition is easier than forecasting. Any independent review should therefore test definitions consistently on unseen data and distinguish a chart annotation from an executable plan with predefined risk. This article is educational commentary, not investment advice or a representation of expected performance.