Key takeaways
2022 ICT Mentorship Episode 19 at www.youtube.com/watch?v=IEa1N0rTtbc explains ICT’s framework for linking higher-time-frame bias with intraday setups across DXY, EUR/USD, GBP/USD and E-mini S&P 500 futures.
Read the full summary
2022 ICT Mentorship Episode 19 at www.youtube.com/watch?v=IEa1N0rTtbc explains ICT’s framework for linking higher-time-frame bias with intraday setups across DXY, EUR/USD, GBP/USD and E-mini S&P 500 futures. ICT targets DXY levels 100 and 101 while treating weakness as a countertrend retracement, finds no immediate EUR/USD bias amid congestion and nothing tradable on the GBP/USD hourly chart, and favors selectivity over daily trading or excessive leverage. The core model combines a fair value gap, a break of a low and a partial or complete return into the gap without requiring exact entry precision. For ES, ICT uses a daily dealing range, midpoint equilibrium or discount, sell-side liquidity and purge and revert to support a bullish premise, then seeks lower-time-frame confirmation through a bullish order block, fair value gap, market-structure shift and relative equal highs. At one hour 34 minutes 10 seconds, he explains that bullish setups are preferably bought below the midnight New York opening price or, if price remains above midnight, below the 8.30 a.m. candle opening price. The example treats declines below both openings as daily and session-level Judas swings. The broader lesson is to define directional bias and a plausible destination before entry, avoid forcing trades in unclear markets, separate higher-time-frame direction from countertrend movement, journal and annotate historical charts, and keep simulated leverage realistic because the episode provides no audited fills, performance record or guaranteed predictive edge.
How we researched this article
BestProps used document-based research from primary firm sources, checked September 25, 2026. The complete source list, scope, limitations, and commercial-state record appear near the end of this article.
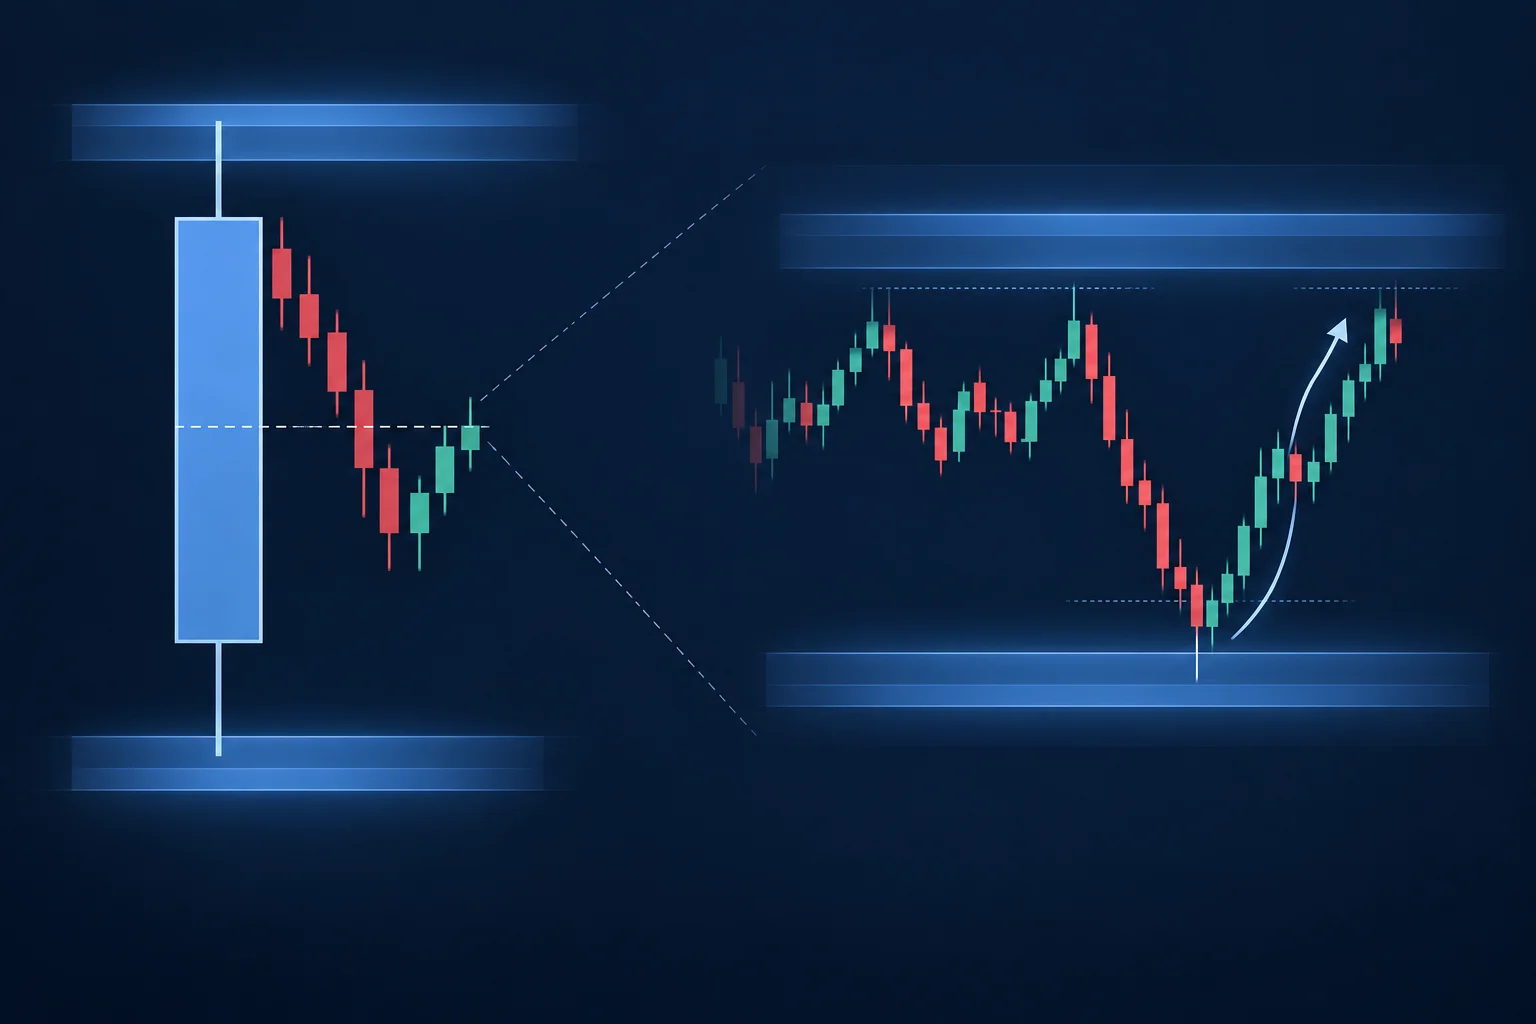
In 2022 ICT Mentorship Episode 19, ICT combines market commentary with a broader lesson about selectivity. The presentation examines the US Dollar Index, EUR/USD, GBP/USD and E-mini S&P 500 futures, but its recurring message is that recognizing an unclear market is as important as identifying a setup.
The episode also develops ICT's framework for connecting higher-time-frame bias to intraday price action. Terms such as fair value gap, order block, displacement, liquidity and the New York opening prices are presented as parts of ICT's own market interpretation, not as independently established predictors or guaranteed trading edges.
ICT Mentorship Model and Price Context
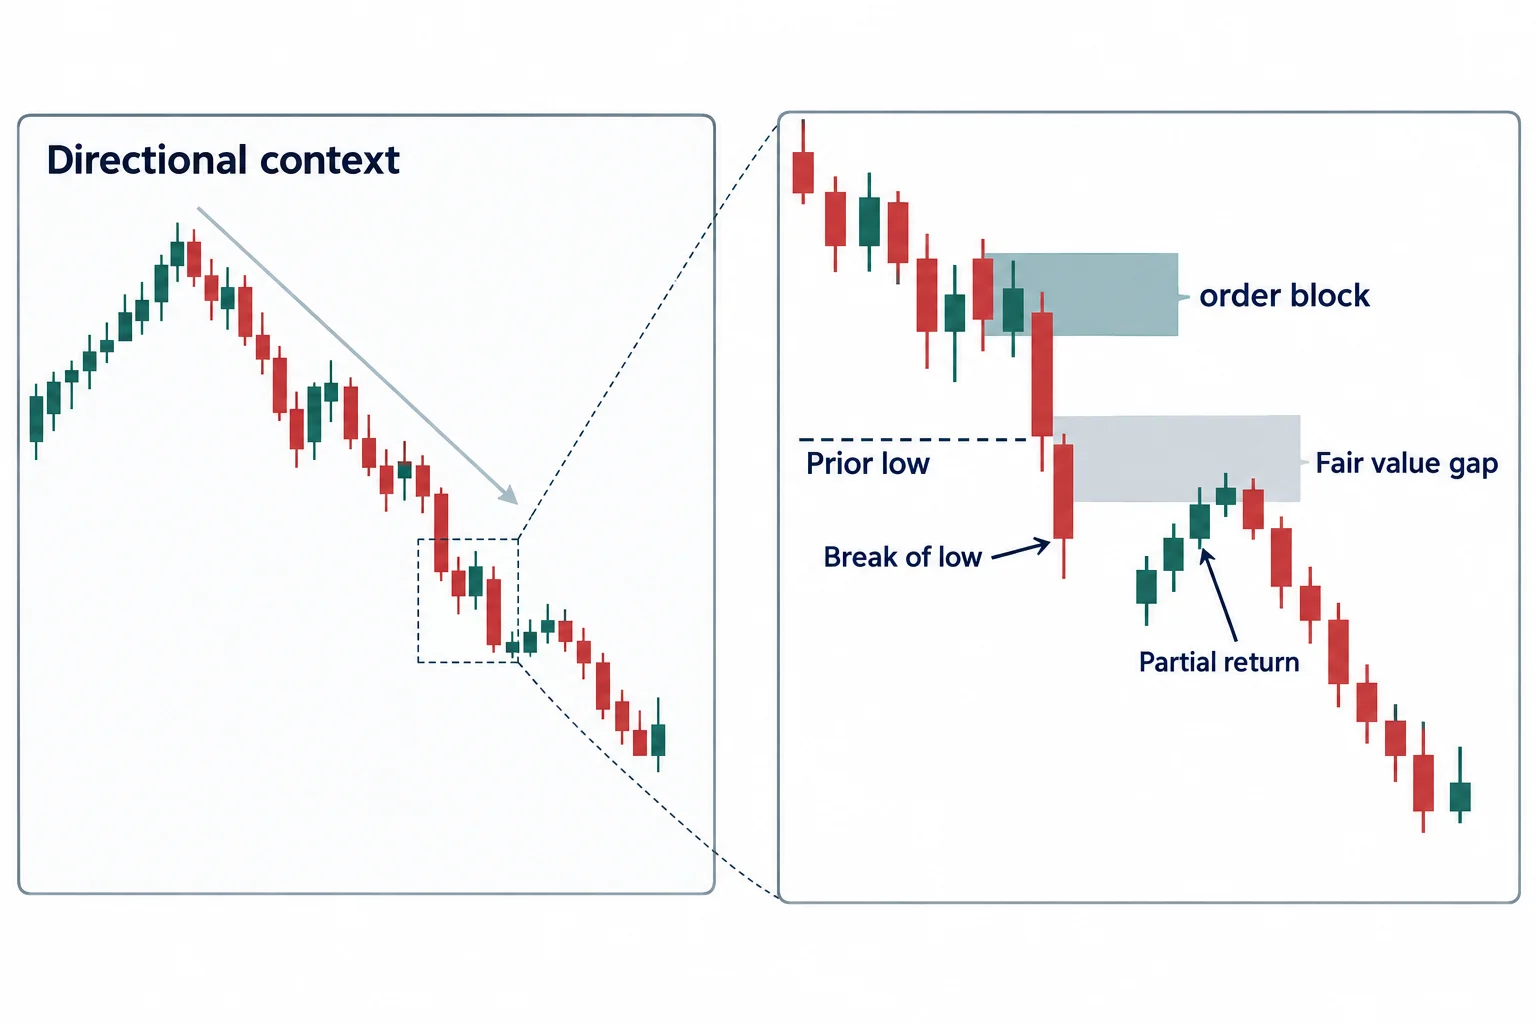
Early in the video, ICT says the public mentorship model was intentionally stripped down to a limited set of observations. Around 6:50, he describes a recurring sequence involving a fair value gap, a break of a low and a return into the gap. He stresses that the return may be partial or complete; exact entry precision is not the central objective.
The larger lesson is that a recognizable pattern cannot be separated from context. ICT repeatedly warns viewers not to listen only for labels such as “fair value gap” or “order block” and then use an isolated phrase to justify a trade. At 18:13, he cautions against selective listening and argues that traders do not need to identify every major top or bottom.
ICT Dollar Price Bias and Countertrend Moves
Beginning near 8:02, ICT reviews a bullish US Dollar Index outlook. He discusses the 100 and 101 levels as objectives he had been monitoring and treats the decline shown in the recording as a retracement rather than confirmation of a major top. He also identifies a move below chart lows as information that could challenge his view, although the unseen chart prevents independent verification of those exact reference points.
On lower time frames, he interprets candle bodies, wicks, an hourly fair value gap and a move toward the midpoint of a larger price swing. At 21:13, he identifies two up-close candles preceding downward displacement as a bearish order block. In ICT’s terminology, this acts like a reference or “bookmark” to which price may return before continuing the prior delivery.
Crucially, ICT labels the bearish movement as counter to his higher-time-frame dollar bias. Around 25:51, he warns that attempting to trade both directions can be especially hazardous for inexperienced participants. His educational preference is to begin by studying alignment with the higher-time-frame view rather than trying to capture every retracement.
ICT Price Bias for EUR/USD and GBP/USD
In the EUR/USD review, ICT says a previously discussed daily low had been reached. He then states that he had no clean near-term directional setup because price had returned to congestion. At 50:47, he explicitly says he has no immediate euro bias and wants to see displacement create a usable range first.
He nevertheless uses an earlier EUR/USD movement to explain a contrarian setup: price moved beneath an old daily low, rallied with displacement and later returned to a fair value gap. He describes a possible move toward a retracement level, but also says this countertrend style is not what he recommends to a new student. The point is analytical recognition, not an invitation to reproduce the trade.
The GBP/USD section is even more direct. At 59:36, ICT says the hourly chart contains nothing he considers tradable. The back-and-forth movement lacks the clean displacement and directional structure he wants. His response is to leave the market alone rather than manufacture a thesis.
That develops into one of the episode’s strongest risk lessons: a trader does not need to transact every day. Near 1:04:16, ICT argues that an inability to outline a reasonable destination for price turns participation into gambling. He also discourages rushing, excessive leverage and the assumption that more activity produces better results.
ICT Price Bias in the E-mini S&P
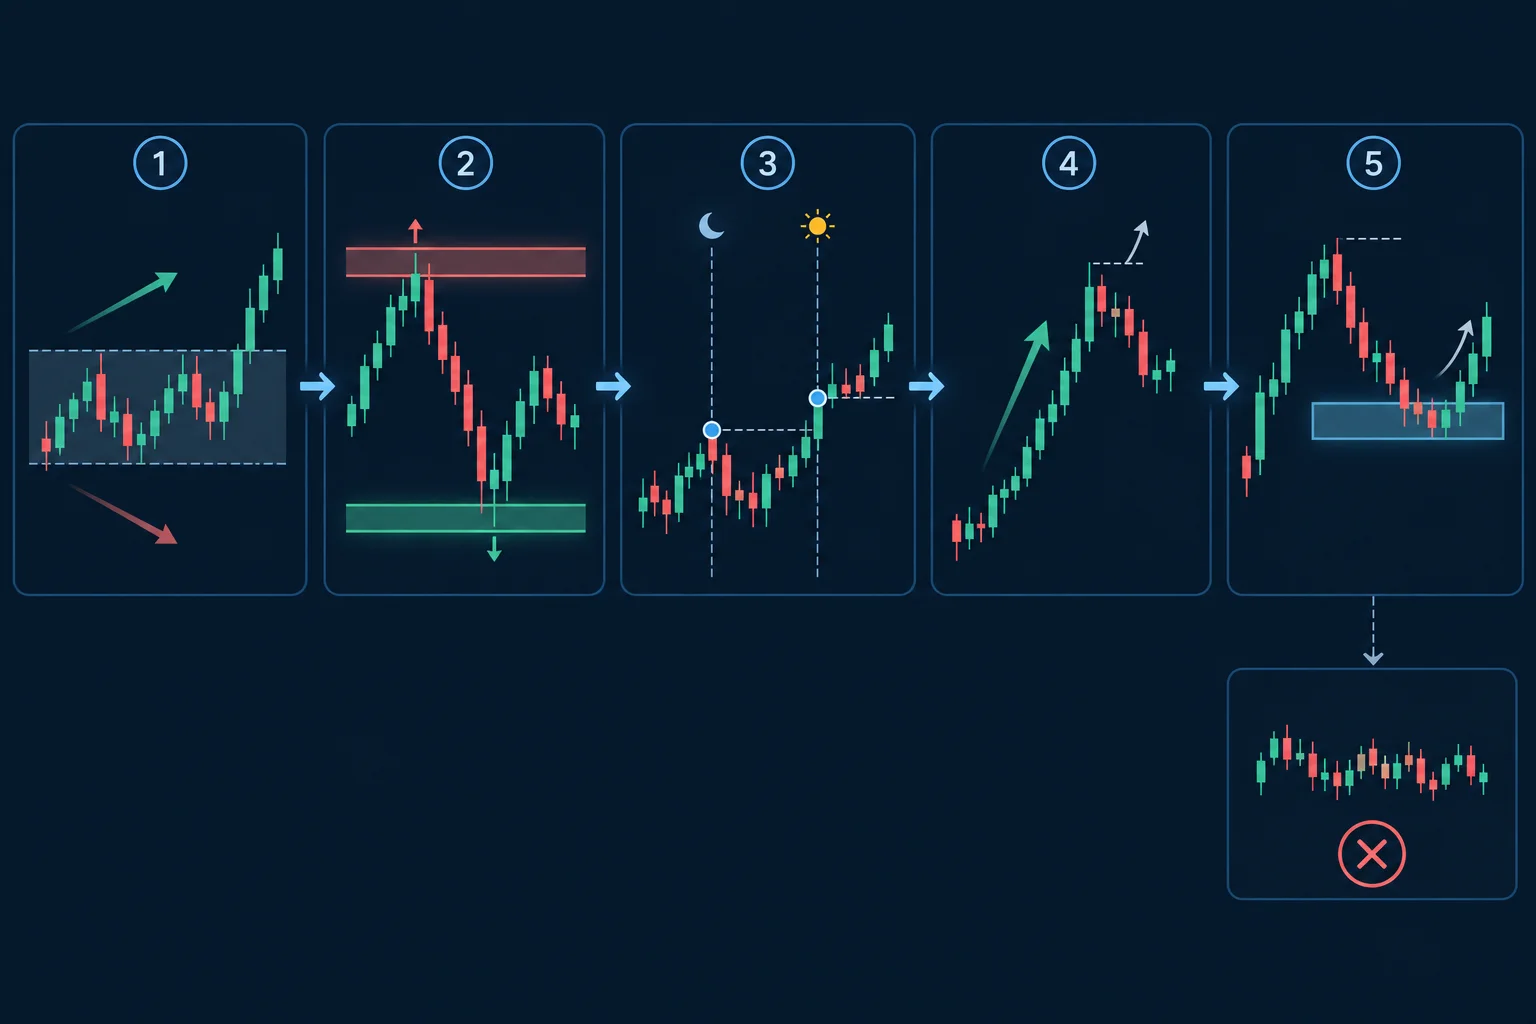
The most detailed technical walkthrough begins at 1:16:44. ICT defines a daily dealing range from a swing low to a swing high and says the market had retraced to roughly the range’s midpoint, which he calls equilibrium or a short-term discount. From that context, he explains why he anticipated a bullish daily move toward an overhead reference area.
He combines that bias with what he calls “purge and revert”: price moves below prior lows, which he interprets as taking sell-side liquidity, and then reverts toward a recent high. The transcript includes a clip that ICT presents as prior commentary, although the supplied captions alone cannot authenticate when that separate clip was recorded or whether it was edited.
Midnight and 8:30 Opening Prices
At 1:34:10, ICT explains that his charts use New York time. For a bullish scenario, he prefers to consider buying below the midnight opening price. If price is already above midnight and does not return below it, he may instead use the 8:30 a.m. New York candle’s opening price as a session reference.
In the example shown, price was below both openings after 8:30. ICT characterizes the overnight decline as a daily “Judas swing” and the post-8:30 decline as a smaller session-level version. He then descends from the 15-minute chart to five- and one-minute charts, identifying a bullish order block, fair value gap, market-structure shift and overhead relative equal highs. The sequence is summarized visually around 1:43:10.
ICT Mentorship Price Bias Takeaways
- Start with a directional premise and a plausible destination before looking for an entry pattern.
- Treat unclear, congested price action as a reason to observe rather than force a trade.
- Separate higher-time-frame bias from short-term countertrend movement.
- Use historical review and chart annotation to test whether a setup is sufficiently consistent for further study.
- Keep simulated position size realistic; ICT argues that exaggerated paper leverage can encourage poor habits.
The episode closes by emphasizing realistic leverage, journaling and process over impressive simulated profits. These are educational observations from ICT’s framework, not proof that the described patterns forecast markets reliably. No setup removes the possibility of loss, and the transcript does not document actual fills, audited performance or what happened after the displayed examples.
ICT Mentorship Resources on Price and Liquidity
- 2022 ICT Mentorship Episode 19 (primary video source) Original YouTube upload, April 21, 2022.
- US Dollar Index (DXY) on TradingView Chart reference for the Dollar Index levels discussed in the episode.
- E-mini S&P 500 Futures (ES) on TradingView Chart reference for the futures example walked through at 1:16:44.
- Fair Value Gap definition (Investopedia) Third-party explanation of the fair value gap concept; unofficial and not endorsed by ICT.