Key takeaways
ICT presents a conditional bearish-breaker and liquidity framework across Bitcoin, Ripple, and a paper-traded forex example around the January 2018 non-farm payroll release, emphasizing that social-media sentiment is not confirmation and that the session does not prove predictive reliability or profitability.
Read the full summary
ICT presents a conditional bearish-breaker and liquidity framework across Bitcoin, Ripple, and a paper-traded forex example around the January 2018 non-farm payroll release, emphasizing that social-media sentiment is not confirmation and that the session does not prove predictive reliability or profitability. For Bitcoin, a bearish breaker is the down-close candle immediately before a run above an old high, with its high, low, and midpoint becoming reference levels after price breaks beneath it. ICT required a daily close above 17,500 before considering a bullish move toward 20,000, viewed the 14,000 area and a three-candle bullish order block as completion of an hourly sell model, and targeted liquidity below old lows under bearish context. For Ripple, he discussed hypothetical partial exits near $3.00 and $3.30, admitted profit-taking percentages were discretionary, and interpreted higher highs on lower volume as distribution. The forex demonstration used bearish order-block and Turtle Soup shorts above the initial daily high, potential reduction near daily-range equilibrium, equal-high liquidity, a return to the bearish breaker, and prior lows as the downside objective. ICT says he did not trade the cryptocurrencies and presented the forex exercise as demo or paper trading, while the article labels claims by source type and notes that charts, executions, fills, datasets, and outcomes cannot be independently verified from the transcript.
How we researched this article
BestProps used document-based research from primary firm sources, checked September 25, 2026. The complete source list, scope, limitations, and commercial-state record appear near the end of this article.
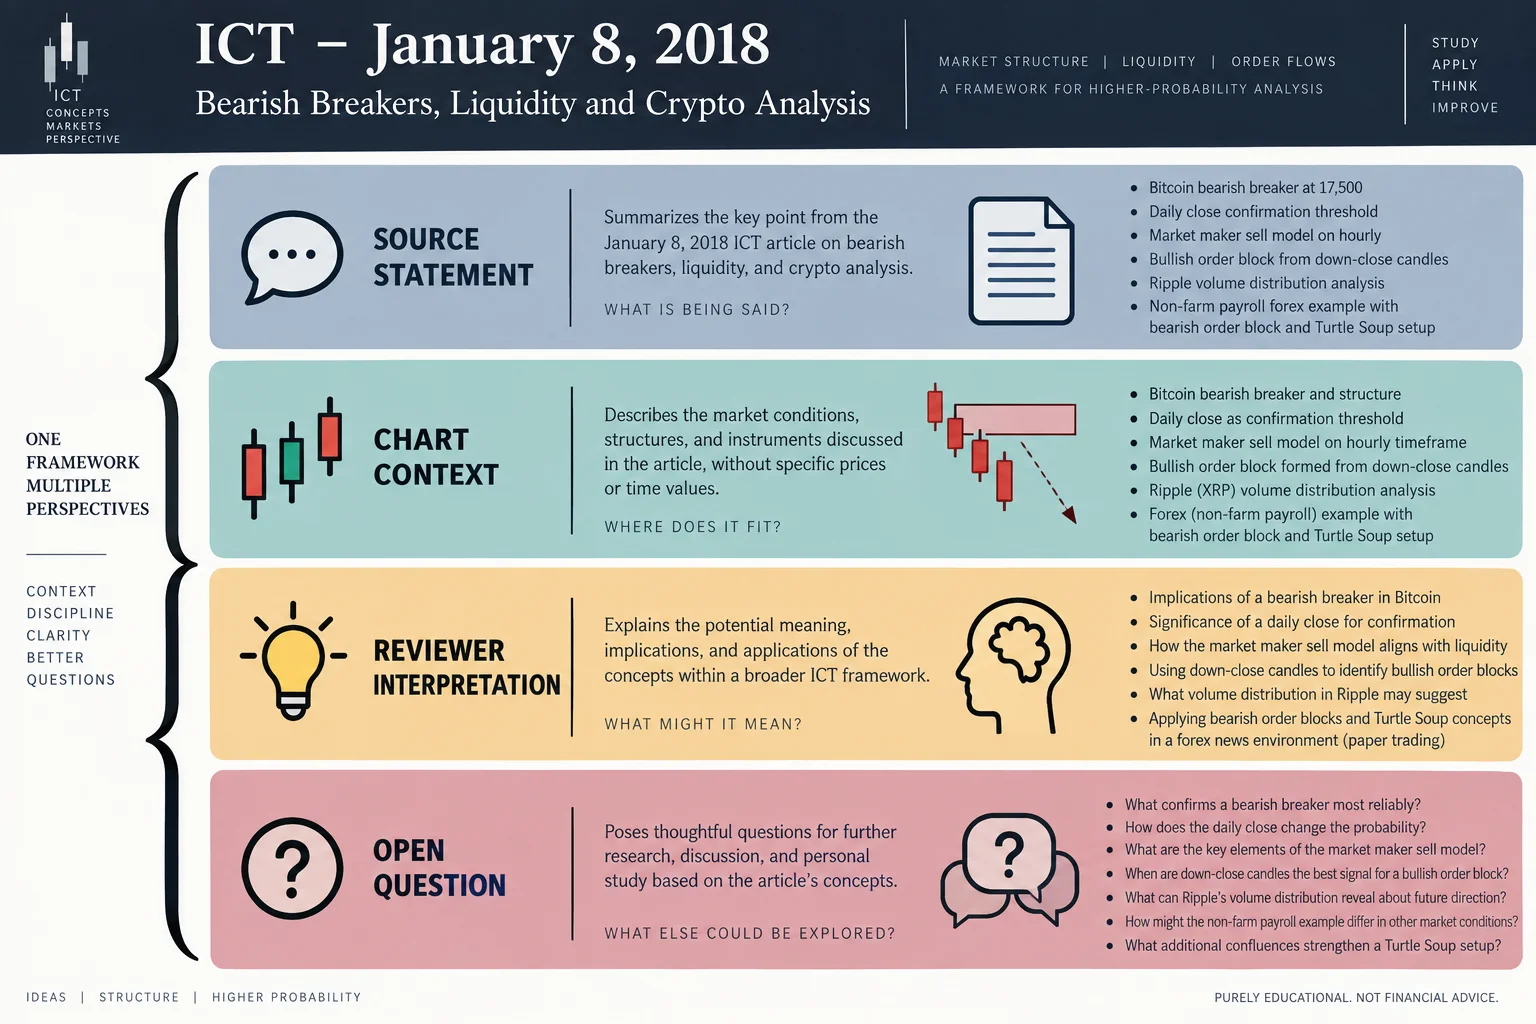
The recording is best treated as an explanation of ICT’s own market model, not proof that the model predicts markets reliably. Much of the presentation depends on charts visible in the video, while the transcript alone cannot independently establish chart prices, executions, fills or later outcomes.
ICT Bearish Breaker Framework for Bitcoin
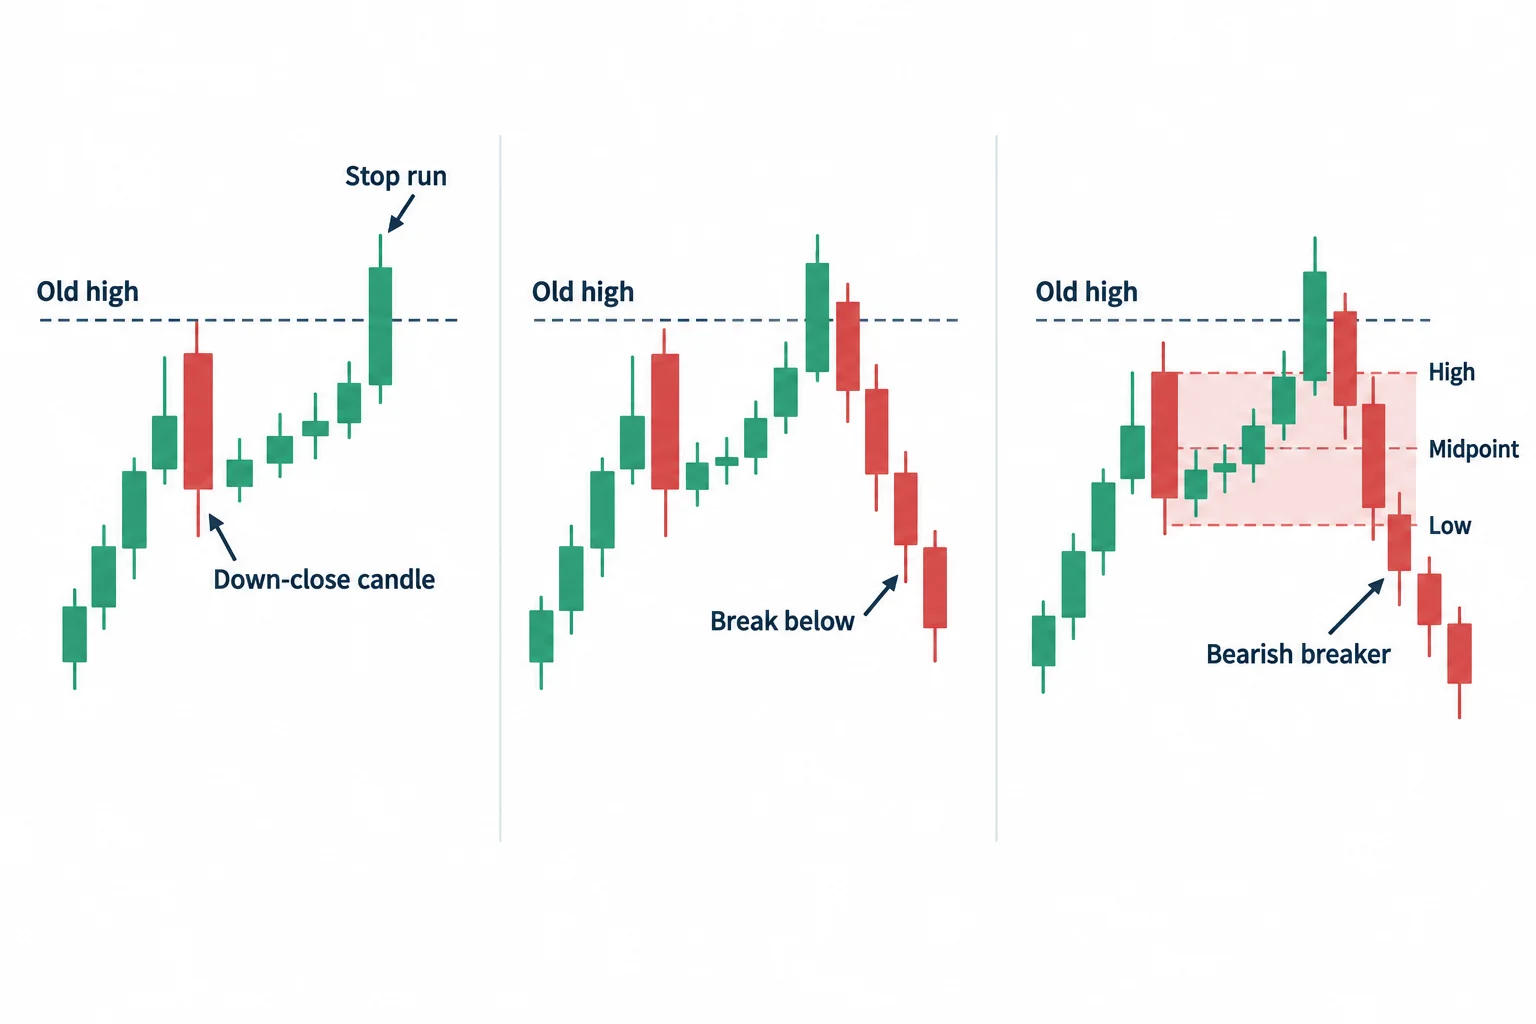
ICT begins the Bitcoin discussion by asking why he considered 17,500 important. At 2:48, he marks prior highs and describes price moving above them as a run on stops. His broader message is that popularity and enthusiastic commentary should not substitute for a technical thesis.
At 7:57, ICT introduces what he calls a bearish breaker. In his terminology, he looks to the down-close candle immediately before price runs above an old high. If price subsequently falls below that candle, he treats its high, low and midpoint as three reference levels. He explicitly distinguishes these levels from a loosely defined supply zone.
ICT then explains his conditional threshold for changing bias. At 12:45, he says Bitcoin would need a daily close above 17,500 (not merely an intraday trade through it) before he would consider a bullish scenario toward 20,000. At the time of the commentary, he says he does not see that confirmation.
This is a useful distinction between a level being touched and a condition being confirmed. In general educational terms, a trading thesis can specify in advance what would invalidate it, which may reduce the temptation to reinterpret every movement as support for an existing opinion.
ICT Hourly Sell Model
Moving to an hourly Bitcoin chart at 13:58, ICT interprets the sequence as a “market maker sell model.” He describes consolidation, a move above an old high, a breakdown and a return toward the prior area before price reaches lower liquidity.
At 16:14, he says the move reached the 14,000 area and a bullish order block formed from three consecutive down-close hourly candles. His explanation treats the three candles as a single three-hour structure because, in his framework, price action is fractal. He also says the short-term setup was complete once that objective had been reached; he did not present this as a live trade he personally took.
ICT summarizes the underlying idea at 18:15: when his context is bearish, he expects orders below old lows to attract price; under bullish context, he watches orders above old highs. These are ICT’s interpretations of liquidity behavior, not independently verified rules of price delivery.
ICT Crypto Liquidity Levels for Ripple
The Ripple section starts around 20:19. ICT says he did not trade or demo-trade the cryptocurrency but was studying whether concepts he taught for other markets could be applied to it. He discusses previously identified levels near $3.00 and $3.30 and describes how he hypothetically would have reduced a long position at those levels.
Importantly, he acknowledges at 22:13 that his approach to taking partial profits was not a fixed, binary system. He characterizes this as a weaker part of his own process and says it depended on experience. That qualification matters: the percentages discussed are retrospective position-management illustrations, not a universal rule.
Beginning at 30:58, ICT adds volume to the Ripple chart. He interprets higher price highs accompanied by lower volume as distribution rather than fresh buying. Later, he looks for increasing volume as price moves lower. These observations describe how ICT read the displayed example; the transcript supplies neither the underlying dataset nor a controlled test of that volume interpretation.
ICT January 2018 Forex Payroll Example
At 42:52, the lesson shifts to forex and footage ICT says he recorded on the prior Friday. He repeatedly identifies the exercise as a demo or paper-trading example rather than a live-money trade.
He outlines two possible short setups: a bearish order-block entry and a “Turtle Soup” setup involving a run above the initial daily high. Around 51:01, he explains that he wanted to sell above that initial high while expecting any further rise to be limited. He later discusses hypothetically taking most of the position off near the daily range’s equilibrium because a post-news market might consolidate rather than reach the full downside objective.
At 1:06:46, ICT returns to the later chart and applies the same bearish-breaker logic: price runs above equal highs, falls below the relevant down-close candles and then revisits the breaker. He identifies liquidity below prior lows as the downside objective in his model.
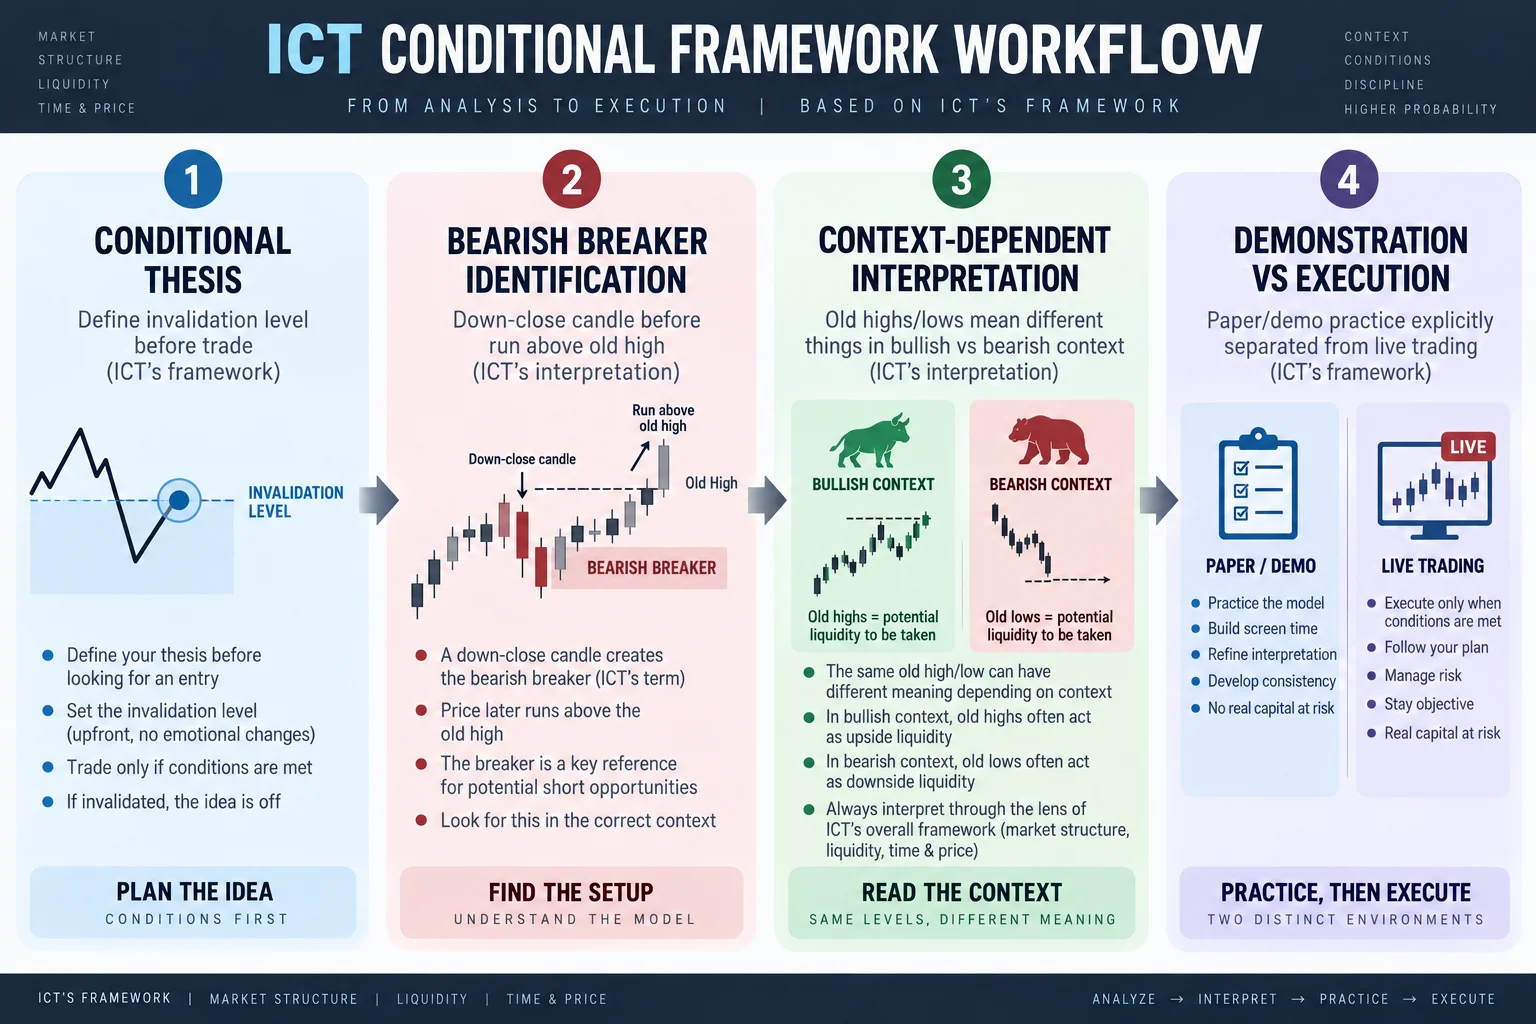
ICT Bearish Liquidity Workflow
ICT January 2018 Trading Lessons
- Define invalidation: ICT required a daily close above 17,500 before revising his Bitcoin view.
- Separate a level from a setup: He says identifying a level does not guarantee a trade; price still must form the expected structure.
- Use context consistently: Old highs and lows are interpreted differently depending on whether the prior thesis is bullish or bearish.
- Avoid sentiment-based commitment: Much of the session warns against using online enthusiasm as confirmation.
- Distinguish demonstration from execution: The forex segment is explicitly presented as paper practice, and ICT says he did not trade the cryptocurrencies discussed.
This video is an extended presentation of ICT’s terminology and retrospective chart interpretation. It can be studied as one framework for organizing observations, but it does not establish profitability or remove market risk. Nothing here is investment advice.
Watch the ICT January 2018 Session
ICT January 2018 Resources
- ICT January 08, 2018 (primary video) Full Inner Circle Trader session on YouTube.
- Non-Farm Payrolls definition (Investopedia) Background on the economic release referenced in the forex example.
- BIS foreign exchange statistics Official market structure data for context on forex liquidity.
- SEC cryptocurrency investment risk alert Regulatory perspective on crypto market risks mentioned in the session.