Key takeaways
ICT OTE Pattern Recognition Series Volume 01 uses AUD/USD data from the Forex.com feed on TradingView to teach a 20-day chart-annotation routine, not a signal service or verified profitable strategy.
Read the full summary
ICT OTE Pattern Recognition Series Volume 01 uses AUD/USD data from the Forex.com feed on TradingView to teach a 20-day chart-annotation routine, not a signal service or verified profitable strategy. The bullish model requires price to cross the previous day’s high, establish a short-term low-to-high impulse before the eight thirty a.m. to eleven a.m. New York observation window, then retrace during that window into the 62% to 79% Fibonacci OTE zone, with 70.5% as the sweet spot. The bearish model reverses the logic around the previous day’s low. Hypothetical invalidation sits beyond the impulse anchor, scaling can use projected Fibonacci and nearby round-number levels, the first partial requires at least 15 pips, and a smaller final portion may be retained for extension while stops are adjusted by market structure rather than the nearest obvious low. ICT recommends at least four weeks of daily hindsight study, accepts immediate expansions as missed trades rather than moves to chase, and stresses that Fibonacci alone is insufficient, losses remain unavoidable, and all examples should be tested through paper trading, demo trading, or simulation.
How we researched this article
BestProps used document-based research from primary firm sources, checked September 25, 2026. The complete source list, scope, limitations, and commercial-state record appear near the end of this article.
In OTE Pattern Recognition Series – Vol. 01, ICT introduces a chart-study routine for recognizing what he calls the Optimal Trade Entry, or OTE. Despite the word “Volume” in the title, this lesson is not about trading-volume data; it is the first installment of the series.
The presentation uses an AUD/USD example and moves from a daily-chart premise to a five-minute study. Its central lesson is that ICT does not define OTE as a Fibonacci retracement in isolation. In his interpretation, the retracement must be considered alongside the previous day’s range, market direction, a specified New York time window and short-term price structure.
ICT OTE Pattern Recognition Goals
ICT opens by describing a planned sequence of 20 daily examples intended to “train the eye.” He explicitly says the series is not a signal service and is not designed to predict what the market must do next. Instead, viewers are encouraged to annotate historical charts repeatedly and become familiar with recurring formations. That objective is explained at 1:15 and expanded upon at 3:03.
He presents hindsight study as a form of deliberate practice: mark prior examples as though they were being observed live, then compare many occurrences over time. ICT recommends at least four weeks of daily observation, while cautioning that this would create familiarity rather than mastery. He also tells new viewers to study his separate OTE primer before relying on this series for context.
ICT Previous Day Price Range Framework
The worked example concerns Australian dollar versus U.S. dollar price action displayed through a Forex.com feed on TradingView. Because the transcript cannot reproduce the chart itself, the important part is the sequence of questions ICT asks.
Mark the Previous Day Price Range
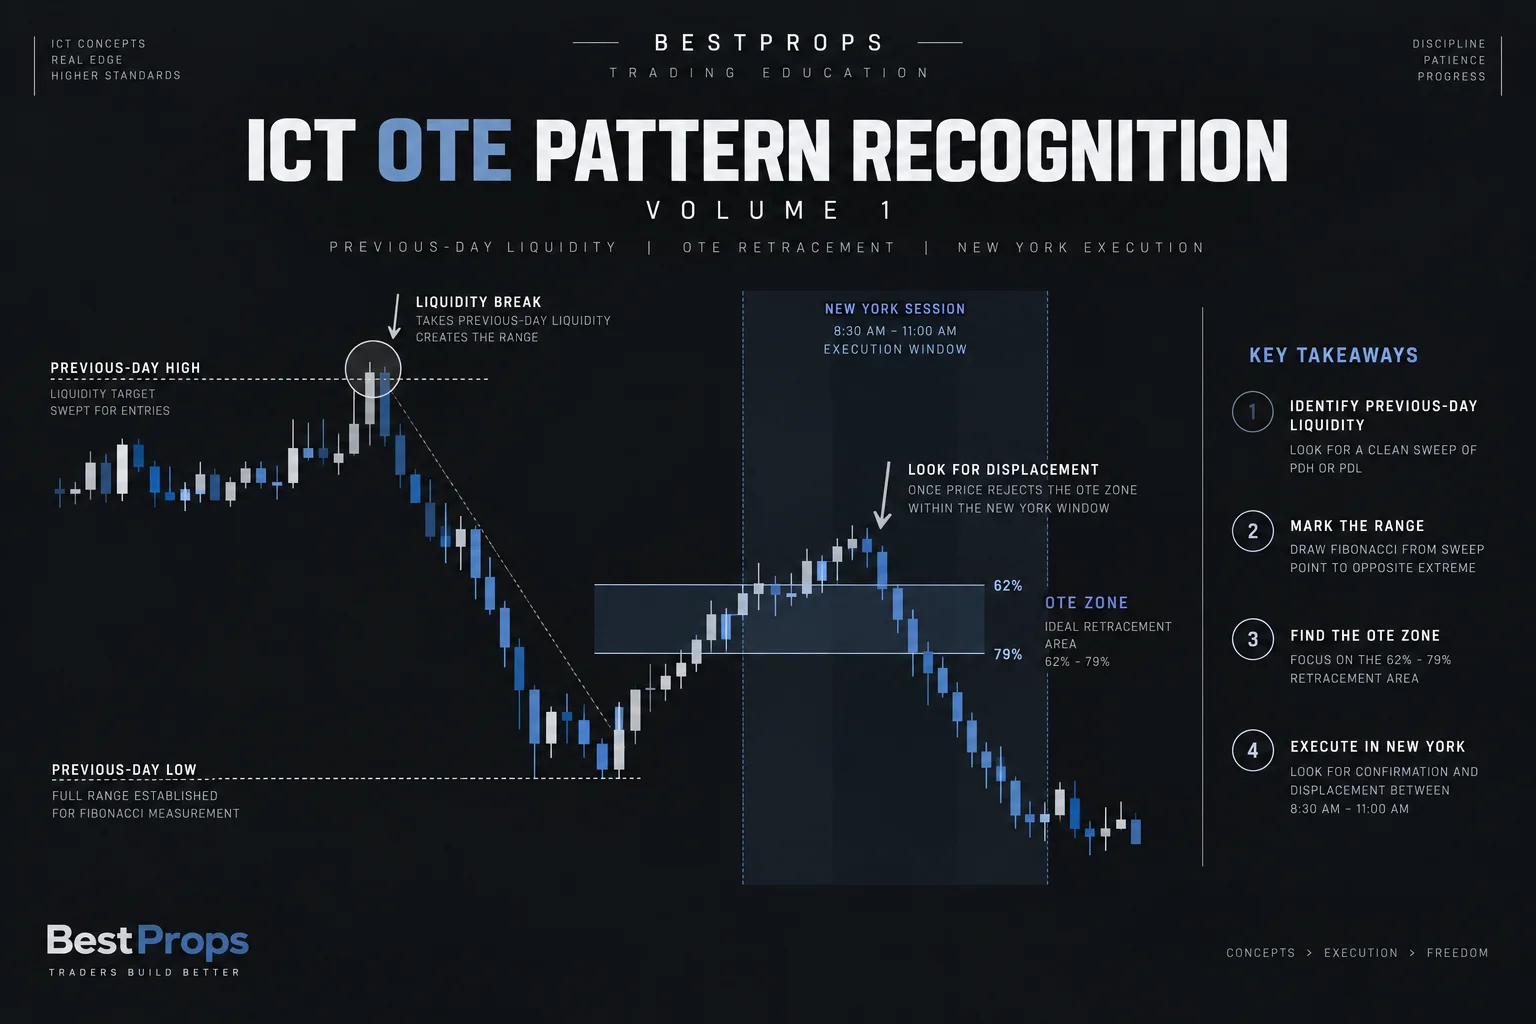
Beginning around 10:43, ICT says the main daily-chart references are the previous day’s high and low. In a bullish scenario, his attention shifts toward whether price can trade through the prior high. In a bearish scenario, the process is inverted around the prior low.
The lesson also refers to a daily bullish order block formed by down-close candles. That concept contributes to ICT’s directional interpretation of this particular example, but the video is not a complete lesson on selecting order blocks or determining bias.
Track Liquidity Beyond the Previous High or Low
ICT describes two broad possibilities after price reaches the relevant prior-day boundary. Price may expand immediately, providing no retracement that fits the model, or it may remain near the level and later retrace. He treats the first case as a missed opportunity rather than a reason to chase the move.
At 18:06, he begins connecting a move through the previous day’s high with the search for a subsequent bullish OTE. The opposite logic is proposed after a move below the previous day’s low.
Combine Price With the ICT Time Window
The distinction ICT emphasizes most strongly is that OTE is not merely any deep retracement. At 26:08, he says the setup combines a specific price area with a specific period of the day.
For this series, the observation window is 8:30 a.m. through 11:00 a.m. New York time. ICT distinguishes this interval from his separate “kill zone” teaching. He associates the opening boundary with the time at which important U.S. releases often occur and the closing boundary with the waning morning session and approximate London-close period. Viewers in other regions would need to convert New York time correctly, including applicable seasonal clock changes.
Define the ICT OTE Retracement Range
At 29:47, ICT identifies the highlighted OTE area as the 62% through 79% Fibonacci retracement zone, with 70.5% treated as its midpoint or “sweet spot.” For the bullish example, the Fibonacci range is drawn from a short-term low to a short-term high established after the previous day’s high has been exceeded. A bearish study would reverse that construction.
This is a description of ICT’s framework, not evidence that these ratios independently predict price. ICT himself says later in the lesson that Fibonacci is a tool for framing the setup rather than an answer to everything in the market.
ICT OTE Price Study Rules
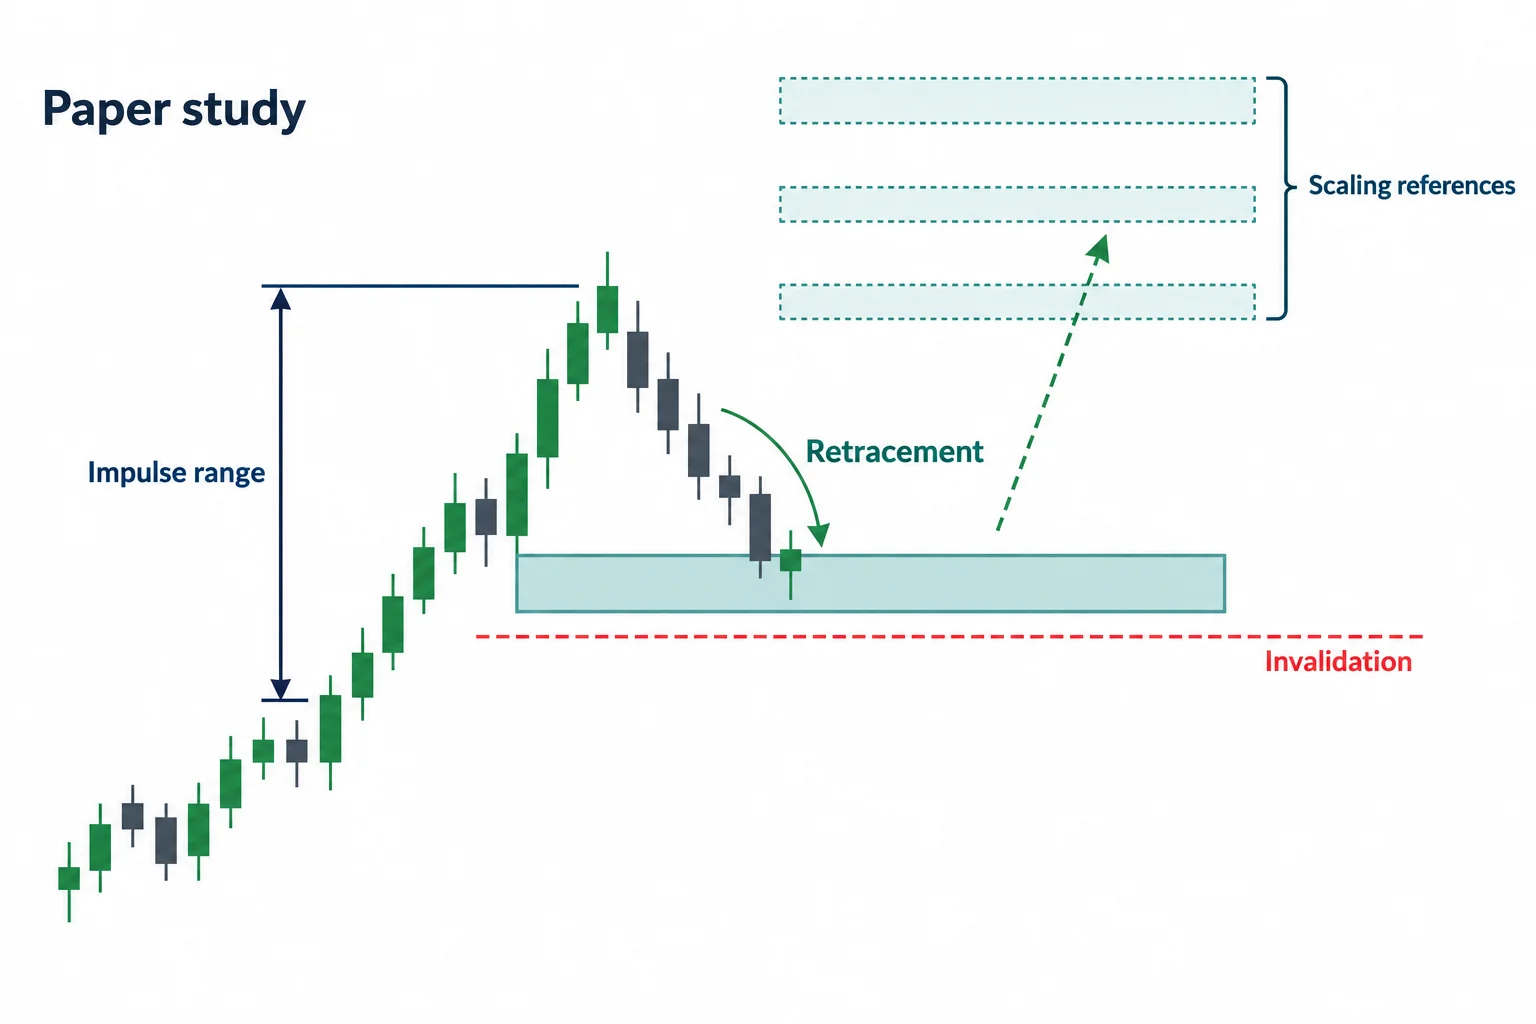
The latter half of Volume 1 illustrates hypothetical entry, stop and scaling rules on the displayed example. ICT repeatedly frames these as paper- or demo-trading material rather than an instruction to commit live funds. The general structure is:
- Wait for price to cross the previous day’s relevant high or low.
- Identify the short-term impulse range before the 8:30–11:00 New York window.
- Watch for a retracement into the 62%–79% area during that window.
- Place the invalidation beyond the impulse-range anchor in the hypothetical model.
- Use projected Fibonacci levels and nearby round-number levels as possible scaling references.
- After partial exits, adjust risk according to market structure rather than placing a stop immediately beneath the nearest obvious short-term low.
The detailed management discussion begins around 36:41. ICT discusses a minimum 15-pip threshold before a first hypothetical partial, projected levels derived from the measured range and retaining a smaller final portion for a possible extension. These are the speaker’s rules for the example, not verified performance statistics.
ICT Previous Day Liquidity Takeaways
The most transferable lesson is the value of a repeatable review process. A student can mark the previous day’s range, record which side was crossed, define the relevant intraday swing, note whether a retracement occurred during the stated window and document what happened without changing the rules after the fact.
ICT also stresses that missed moves and losing outcomes are unavoidable. Near 46:03, he argues that strict criteria can reduce impulsive decision-making, while explicitly rejecting the idea that the pattern is a recipe for winning every trade.
Accordingly, Volume 1 is best understood as an introduction to ICT’s pattern-recognition exercise: study one clearly defined setup repeatedly, combine time and price conditions, and evaluate it through chart annotation or simulation before drawing conclusions. It does not establish profitability, and the transcript alone cannot verify chart prices, fills, spreads or later outcomes.