Key takeaways
ICT’s November 2018 mentorship preview interprets GBP/USD and Bitcoin through liquidity, directional narrative and higher-time-frame context rather than isolated patterns.
Read the full summary
ICT’s November 2018 mentorship preview interprets GBP/USD and Bitcoin through liquidity, directional narrative and higher-time-frame context rather than isolated patterns. For GBP/USD, ICT uses weekly and daily charts to establish bearish order flow, viewing equal highs and rallies above prior highs as buy-side liquidity sweeps that may create selling opportunities. Around 17 minutes 4 seconds, he identifies a bearish breaker, measures consolidation equilibrium at 50%, applies Fibonacci retracement for an optimal trade entry area and outlines aggressive entries, confirmation after downward intent and later retracements into a bearish order block. At 31 minutes 28 seconds, he argues that waiting for a breakdown and retracement gives up entry price for confirmation, while clips beginning at 35 minutes 44 seconds pair bearish preferences with invalidation levels. For Bitcoin, ICT notes a break below multi-month consolidation, identifies about $3,000 as a possible buying or short-covering area and roughly $2,500 as a potential liquidity target, while saying a move above referenced hourly highs would weaken the bearish scenario. He did not trade cryptocurrency, and the article stresses that his chart markings, executions, pip claims and results cannot be independently verified from captions. The main lessons are to form a hypothesis before hearing the presenter, link lower-time-frame setups to a higher-time-frame premise, define invalidation, stand aside amid unclear event risk such as Brexit and avoid assuming that a large decline alone proves an asset is undervalued or ready to rebound.
How we researched this article
BestProps used document-based research from primary firm sources, checked September 25, 2026. The complete source list, scope, limitations, and commercial-state record appear near the end of this article.
In the November 2018 video “ICT Musings On GbpUsd & Bitcoin – Mentorship Level Preview”, ICT reviews an hourly GBP/USD chart and then discusses Bitcoin’s decline. The common thread is his interpretation of price through liquidity, directional narrative and higher-time-frame context rather than isolated chart patterns.
This is a retrospective explanation of ICT’s views in that recording, not a validation of the method or a current market forecast. The video includes precise historical levels and performance claims, but the captions alone cannot verify chart markings, executions or later results.
ICT GBPUSD Chart Preview Questions
At 2:13, ICT explains his “WDYS” prompt: “What do you see?” He asks viewers to pause on the displayed GBP/USD hourly chart and form a scenario before hearing his analysis. The exercise is intended to separate observation from hindsight.
His broader teaching point is that recognizing terminology is not the same as constructing an analysis. He criticizes the mechanical use of concepts such as order blocks or apparent price inefficiencies without first establishing a directional premise.
ICT GBPUSD Liquidity Outlook
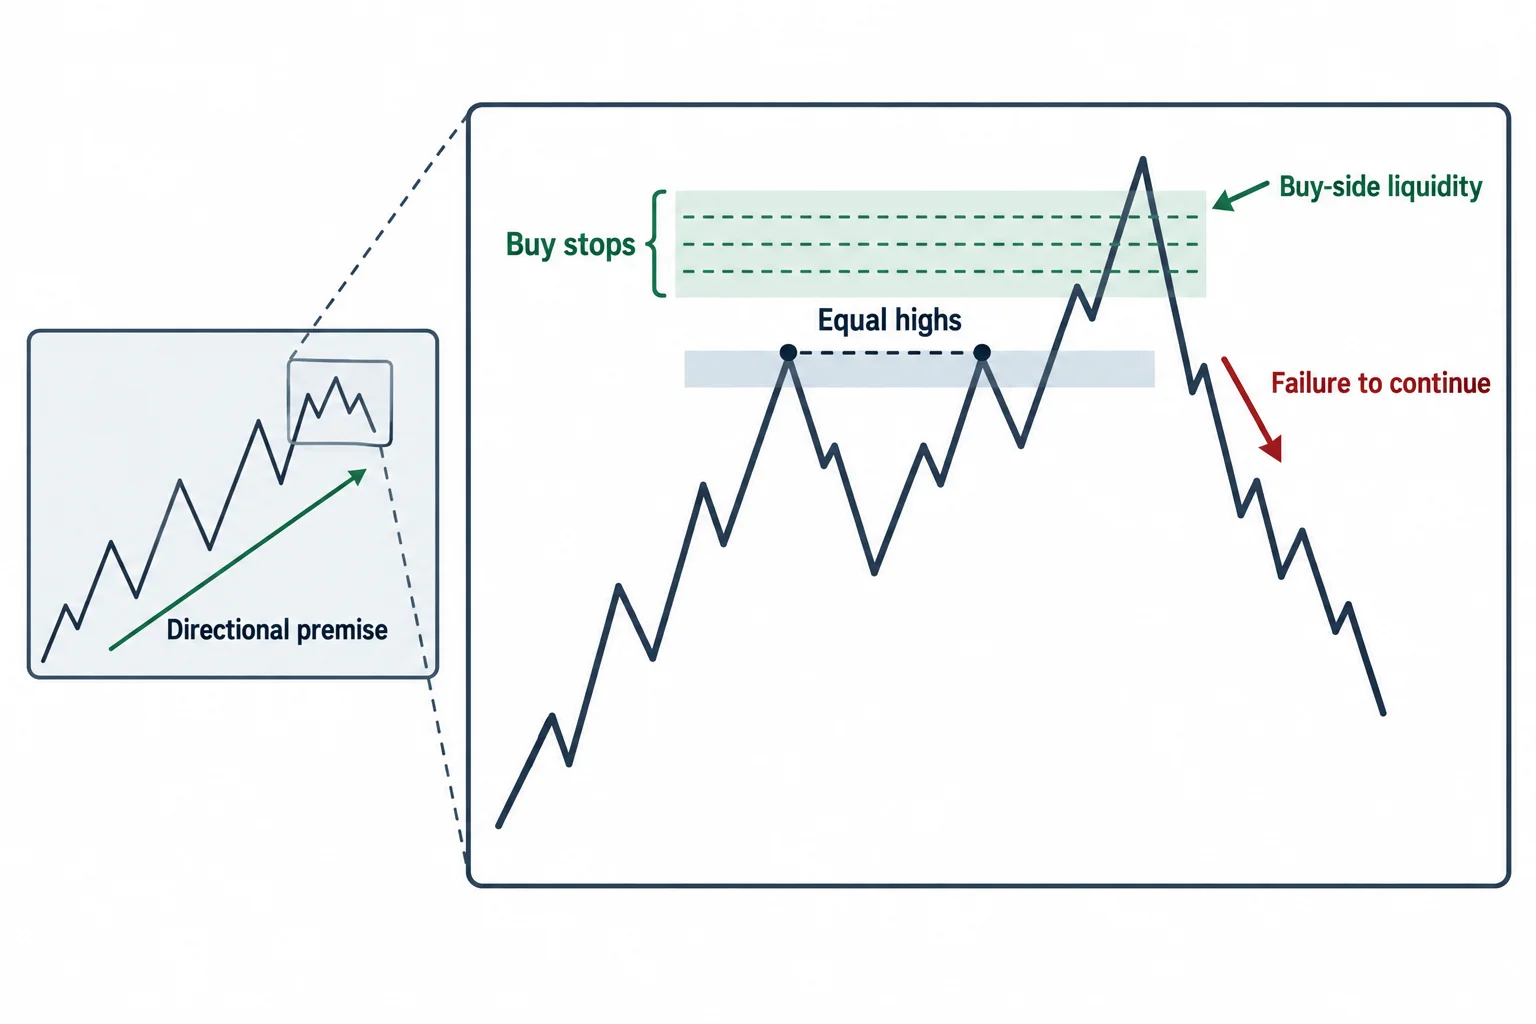
ICT’s cable analysis starts with what he describes as equal highs, a run on buy-side liquidity and a subsequent failure to continue higher. At 6:10, he interprets the movement above prior highs as the removal of buy stops before a decline.
He also acknowledges the event risk surrounding Brexit. At 7:13, he says traders should stand aside when the setup is unclear rather than assume that every move has an obvious direction. That caution is one of the more transferable lessons in the presentation: a framework can produce a hypothesis, but it does not remove uncertainty.
GBPUSD Bias Before Trade Setups
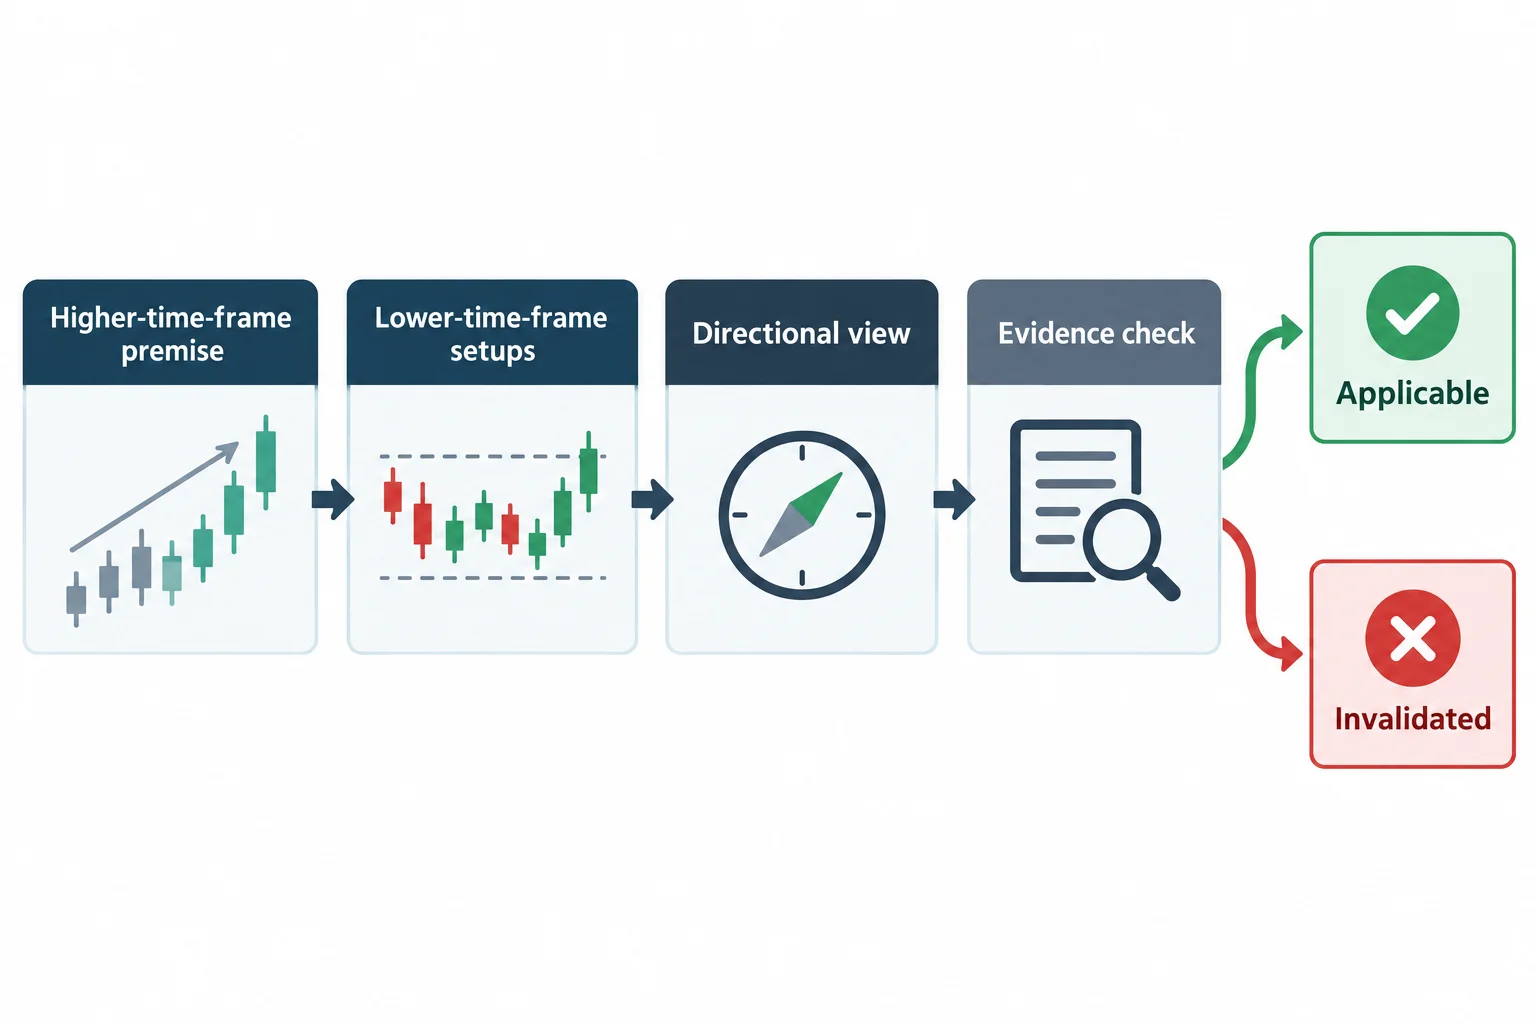
At 10:12, ICT argues that a market idea needs a storyline. In his framework, that means beginning with a higher-time-frame directional premise and then looking for lower-time-frame evidence consistent with it. He suggests using weekly and daily charts as a practical pairing for forming that premise.
For this historical GBP/USD example, ICT characterizes the prevailing order flow as bearish. He reasons that price had already been moving lower before retracing above a group of highs. He therefore treats later rallies into buy-side liquidity as potential selling locations rather than evidence of a new uptrend.
GBPUSD Liquidity Breakers and Retracements
The central technical section begins around 17:04. ICT identifies what he calls a bearish “breaker”: in his terminology, a down-close candle preceding a move that clears highs and then reverses. He says the concept should be interpreted within the surrounding sequence of liquidity and price delivery, not as a candle pattern in isolation.
He next measures a consolidation range and describes its 50% point as equilibrium or fair value. From there, he uses a Fibonacci retracement to define what he calls an optimal trade entry area. His argument is that the context determines whether an apparent imbalance should be revisited. In this case, he says the earlier rally had already completed the relevant liquidity objective, so he did not expect every portion of the move to be “filled.”
ICT then discusses several possible entry styles:
- An aggressive entry during a retracement into his defined area.
- Waiting for price to demonstrate downward intent.
- Using a later retracement into what he labels a bearish order block.
At 31:28, he emphasizes that a trader need not anticipate the initial turn. Within his framework, waiting for a breakdown and retracement sacrifices some entry price in exchange for more confirmation. This is an educational description of ICT’s chart-reading process, not evidence that such formations reliably predict markets.
ICT Mentorship Level Preview
Beginning at 35:44, the video presents clips that ICT says came from earlier mentorship commentary. In those clips, he states a bearish preference while also describing a price level that would invalidate or postpone that view.
This distinction is useful analytically: a directional hypothesis should include conditions under which it is no longer applicable. However, the transcript cannot independently establish when the inserted clips were recorded, what the unseen charts displayed or whether any real trades were placed. ICT’s comments about captured pips and consistency should therefore be treated as his own claims.
ICT Bitcoin Liquidity Outlook
The discussion turns to Bitcoin at 41:11. ICT observes that Bitcoin had broken below a multi-month consolidation. He considers approximately $3,000 a possible area for buying activity or short-covering, while suggesting that liquidity below prior lows could draw price toward roughly $2,500.
He expressly notes that he did not trade cryptocurrency and was analyzing only the price chart. On the hourly view, he interprets a rally above short-term highs as a sweep of stops belonging to short sellers. His bearish scenario would be weakened, he says at 49:03, if price traded above the highs he was referencing on screen.
ICT also challenges the assumption that an asset must rebound merely because it has fallen substantially from its high. His general point is that confidence in a technology or industry does not, by itself, establish a near-term price floor. He urges emotionally committed holders to consider downside risk and capital preservation, though his specific Bitcoin projections remain personal market interpretations from 2018 rather than current guidance.
ICT Mentorship Takeaways for GBPUSD and Bitcoin
- Form a hypothesis before seeing the presenter’s conclusion to reduce hindsight bias.
- Do not treat one candle, order block or retracement level as a complete strategy.
- Connect lower-time-frame setups to a clearly stated higher-time-frame premise.
- Define what would invalidate a directional view.
- A chart interpretation is not a verified trade or proven edge.
- A large decline alone does not demonstrate that an asset is undervalued or ready to reverse.
The complete historical presentation is available in the primary video. The material is educational commentary on ICT’s stated framework and should not be read as investment advice or a performance promise.