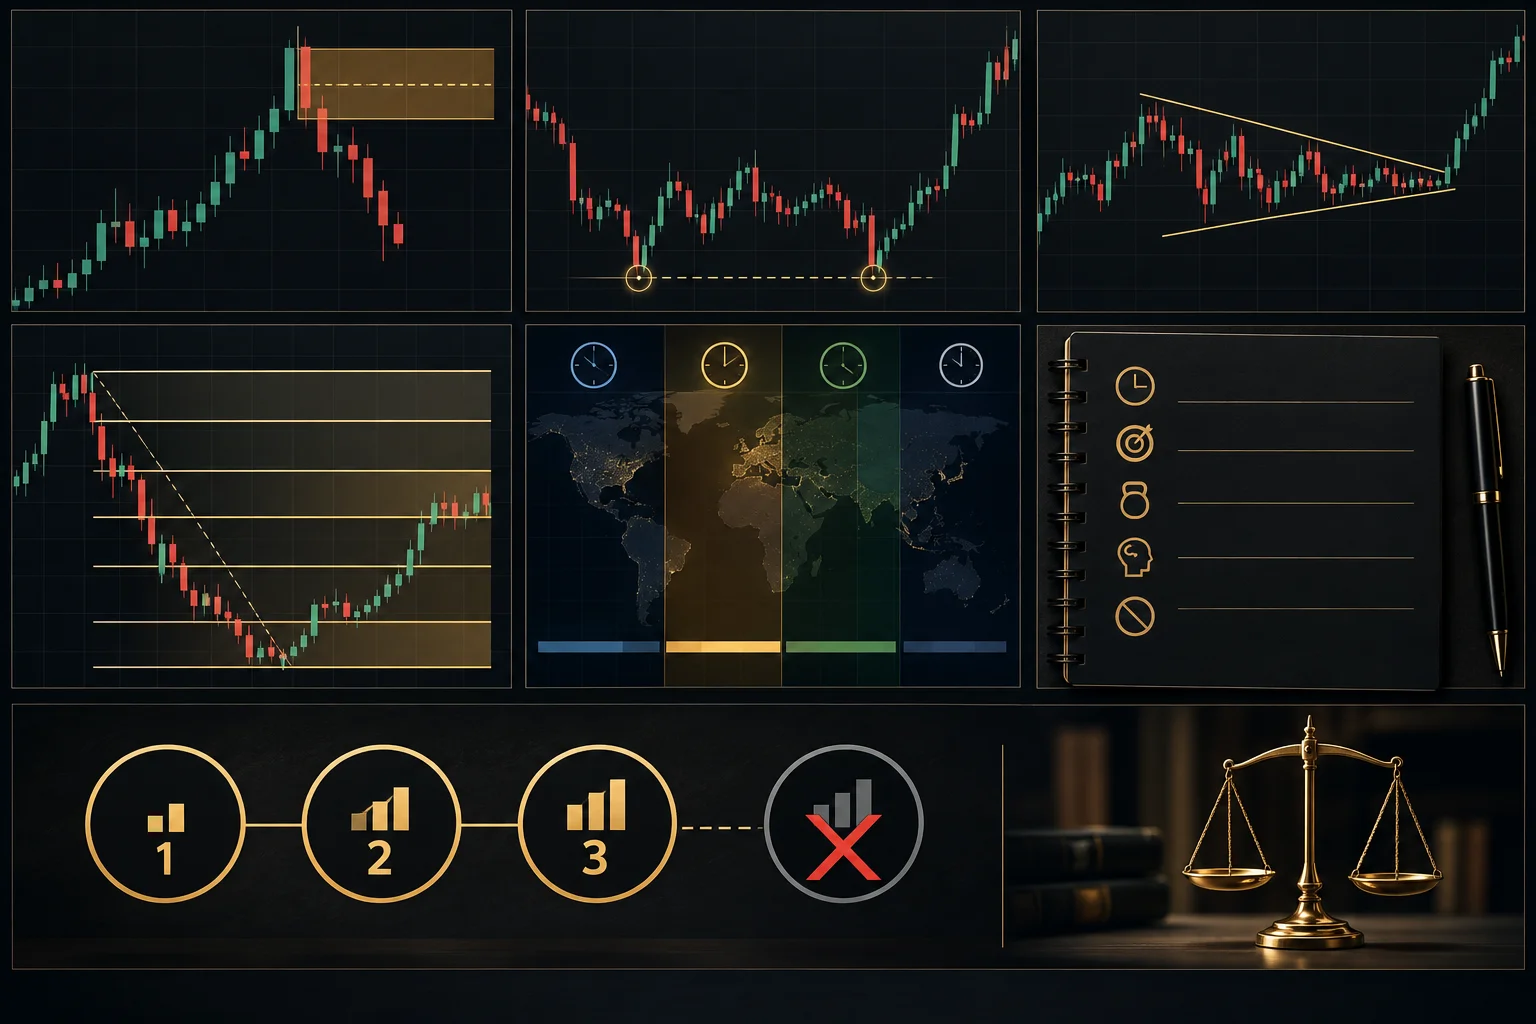
Key takeaways
ICT Weekly Recap and Table Talk Session 11/17/17 presents ICT’s discretionary currency-trading framework through EUR/USD, JPY, GBP/USD, and USD/CAD reviews, emphasizing equal highs and lows, old range boundaries, monthly bearish order blocks, session timing, market-structure shifts, and Fibonacci as a descriptive premium and discount tool rather than a price-moving force.
Read the full summary
ICT Weekly Recap and Table Talk Session 11/17/17 presents ICT’s discretionary currency-trading framework through EUR/USD, JPY, GBP/USD, and USD/CAD reviews, emphasizing equal highs and lows, old range boundaries, monthly bearish order blocks, session timing, market-structure shifts, and Fibonacci as a descriptive premium and discount tool rather than a price-moving force. On EUR/USD he adapted when price missed his preferred selling level, targeted sell stops below equal lows, and warned against demanding exact tops or bottoms. On GBP/USD he expected a move above equal highs before a decline and noted that shorting a double top automatically could have caused a stop-out. On USD/CAD he disclosed a stopped-out long, reassessed after a perceived structure shift, and explained manual calibration to 7 a.m. New York time because broker-server clocks and daylight-saving changes vary. His charting process marks equal highs and lows, previous-day extremes, expected trading windows, invalidation points, and actual outcomes while using only selective Fibonacci anchors. From 1 hour 27 minutes 4 seconds, he recommends journaling trades and decisions not to trade, including entry times, time expectations, physical and emotional condition, and reasons for standing aside, with review leading him to selected windows and no more than three attempts daily. The session acknowledges that experience is required, exits remain a weakness in ICT’s process, and the material neither independently verifies liquidity claims or fills nor establishes profitability.
How we researched this article
BestProps used document-based research from primary firm sources, checked September 25, 2026. The complete source list, scope, limitations, and commercial-state record appear near the end of this article.
In ICT Weekly Recap & Table Talk Session – 11/17/17, ICT reviews several currency pairs and expands the discussion into execution, chart annotation, Fibonacci use, trading psychology, and journaling. Although the title refers to 11/17/17, YouTube lists the upload date as December 9, 2017.
The session is less a compact setup tutorial than a long-form explanation of how ICT says he organizes price information. His recurring themes are equal highs and lows, prior range boundaries, selected trading windows, and adaptation when price does not reach an anticipated level. These are ICT’s interpretations of market behavior, not independently established rules or guarantees of an edge.
ICT Session Lessons From the EUR/USD Trade
ICT begins with a EUR/USD trade review. At 00:33, he explains that he had expected a rally toward a higher selling area. He identifies what he calls a monthly bearish order block (the last up-close monthly candle) and calculates its midpoint from the levels stated in the presentation.
Price did not reach his preferred level. Instead of presenting the original forecast as perfect, ICT says he adapted to the failure and considered a short closer to the preceding consolidation. At 04:28, he points to equal lows as a prospective pool of sell stops and describes them as the downside objective.
His broader execution lesson is that a trader need not capture the exact extreme. Around 04:56, he says his exit did not occur at the absolute low and cautions students against demanding perfect highs or lows. That warning is important because the transcript records his retrospective explanation but cannot verify the chart’s unseen details, fills, or subsequent result.
ICT Session Lessons on Concepts and Indicators
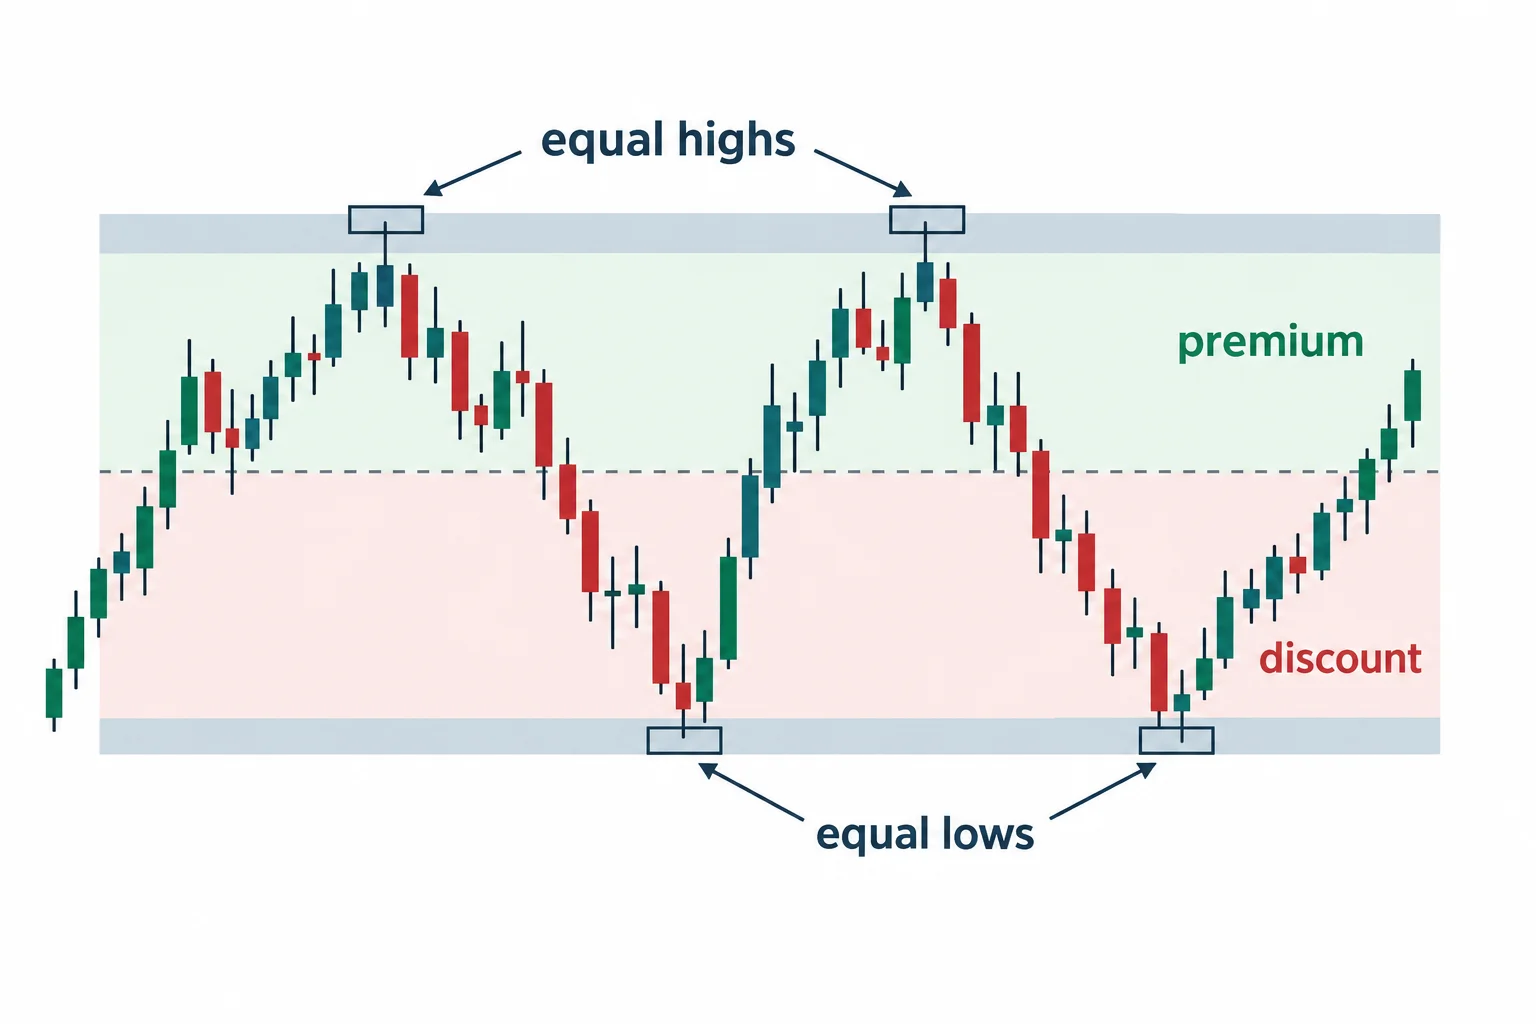
During the Japanese-yen discussion, ICT shifts attention from tools to underlying references. At 07:15, he discusses a potential run above equal highs. He then argues that average daily range and session-window indicators can be reproduced manually and should not replace reasoning about price and time.
His practical charting method is intentionally simple:
- Mark equal highs or equal lows with a small rectangle.
- Identify old highs, old lows, and previous-day boundaries.
- Annotate the time window in which a setup is expected.
- Use Fibonacci as a way to describe a range, not as the force moving price.
- Wait for the selected conditions rather than forcing the same pattern across every pair.
At 16:05, ICT stresses that not every visible swing is an equally useful Fibonacci anchor. He says his Fibonacci measurement represents a defined price range and helps describe relative premium or discount. Later, at 48:58, he states even more directly that Fibonacci itself is not powerful; in his framework, it merely highlights levels already selected through his reading of price.
ICT Session Lessons From the GBP/USD Price Draw
The GBP/USD review begins near 18:33. ICT frames the first question as identifying the “draw” on price: whether price is expected to move toward an old high, an old low, or another defined range.
He describes expecting price to trade above equal highs before declining. His interpretation is that conspicuous double tops can attract price because protective buy stops may be resting above them. Conversely, equal lows may represent a downside objective. This stop-location narrative is central to ICT’s model, but the captions do not provide order-book evidence confirming who held orders at those levels.
The discussion also contains a useful risk acknowledgment. Around 21:24, ICT says an earlier short based only on the nearby highs could have been stopped out. He explains that he waited for a higher reference area instead. Whether or not one accepts his market interpretation, the educational distinction is clear: a visible double top alone is not treated as an automatic resistance trade.
ICT Session Lessons From the USD/CAD Loss
At 26:36, ICT turns to USD/CAD and openly reports that an earlier long attempt was stopped out. He then describes reassessing the market after what he labels a market-structure shift and another interaction with equal highs.
The USD/CAD segment also demonstrates how he manually marks time windows. Beginning around 30:40, he discusses calibrating a platform to 7:00 a.m. New York time. He warns that broker-server time varies and says users must determine the corresponding platform time themselves. He also describes overlapping annotations around daylight-saving transitions rather than relying solely on an automated session indicator.
This section is best understood as a chart-organization practice, not proof that a time window predicts direction. ICT himself later says experience remains necessary and that not every decision can be reduced to a binary rule.
ICT Session Lessons on Execution and Journaling
The closing portion becomes a broader table talk on development and self-review. At 41:50, ICT says some judgments cannot be communicated as simple rules and require experience. He also admits that exits are a persistent weakness in his own process, despite viewing his entry framework as more structured.
His strongest general educational point is journaling. Starting near 1:27:04, ICT recommends documenting not only trades but also decisions not to trade. He says his records include entry times, time-based expectations, physical or emotional condition, and reasons for standing aside. Near 1:30:49, he explains that reviewing those notes led him to limit his activity to selected windows and no more than three attempts per day.
Key ICT Session Lessons for Traders
A neutral way to study this session is to separate observable chart features from ICT’s explanations for them. A learner could mark equal highs and lows, previous-day extremes, intended session windows, invalidation points, and actual outcomes in a journal. The resulting sample can then be reviewed without assuming in advance that liquidity was present or that a setup must work.
The video offers a detailed account of ICT’s discretionary framework, including a losing attempt and his dissatisfaction with exit consistency. It does not establish profitability, independently verify all trade claims, or supply enough information to reproduce unseen fills. The material is educational commentary, not investment advice.