
Key takeaways
ICT’s restart plan prescribes six months of OTE backtesting followed by six months of paper or demo forward testing with no live funds during the first year, focusing only on EUR/USD from 8:30 a.m.
Read the full summary
ICT’s restart plan prescribes six months of OTE backtesting followed by six months of paper or demo forward testing with no live funds during the first year, focusing only on EUR/USD from 8:30 a.m. to 11 a.m. New York time on Monday through Wednesday. The May 17, 2021 paper-trade example requires bullish structure and weekly bias, a rally through a short-term high as a market-structure shift, a retracement into the 62% to 79% Fibonacci region overlapping a bullish order block, untouched highs as buy-side liquidity targets, and a prospective reward of at least three times defined risk. Fibonacci is only a visual aid, while direction, structure, liquidity and time of day determine whether the setup qualifies. Analysis moves from hourly to 15-minute and five-minute charts, with order blocks treated as fractal, and the illustrated entry uses a later return to an order block because the ideal OTE had already occurred. Beginners can exit before a nearby high once the three-to-one objective is met, then gradually learn a double-tap exit with one partial close and one final close at a second target. If no qualifying setup appears by Wednesday, the trader records observations and takes no trade that week. Journals should include winners and failures, and the framework should be treated as a testable simulation exercise rather than proof of profitability or a performance guarantee.
How we researched this article
BestProps used document-based research from primary firm sources, checked September 25, 2026. The complete source list, scope, limitations, and commercial-state record appear near the end of this article.
In “If I Had To Restart Again As A Trader, At 20 Years Old – Part 3”, ICT explains how he would move from historical study into simulated execution. The lesson uses a May 17, 2021 EUR/USD example to illustrate his Optimal Trade Entry (OTE) framework, target selection, setup filtering and gradual skill development.
The example was described as a paper trade, not a live-money position. Although ICT makes strong claims about the potential of his approach, those claims are his interpretations and promises, not independently established results. The practical educational theme is narrower: develop written rules, study a large sample, practise without financial risk and accept that some valid-looking setups will fail.
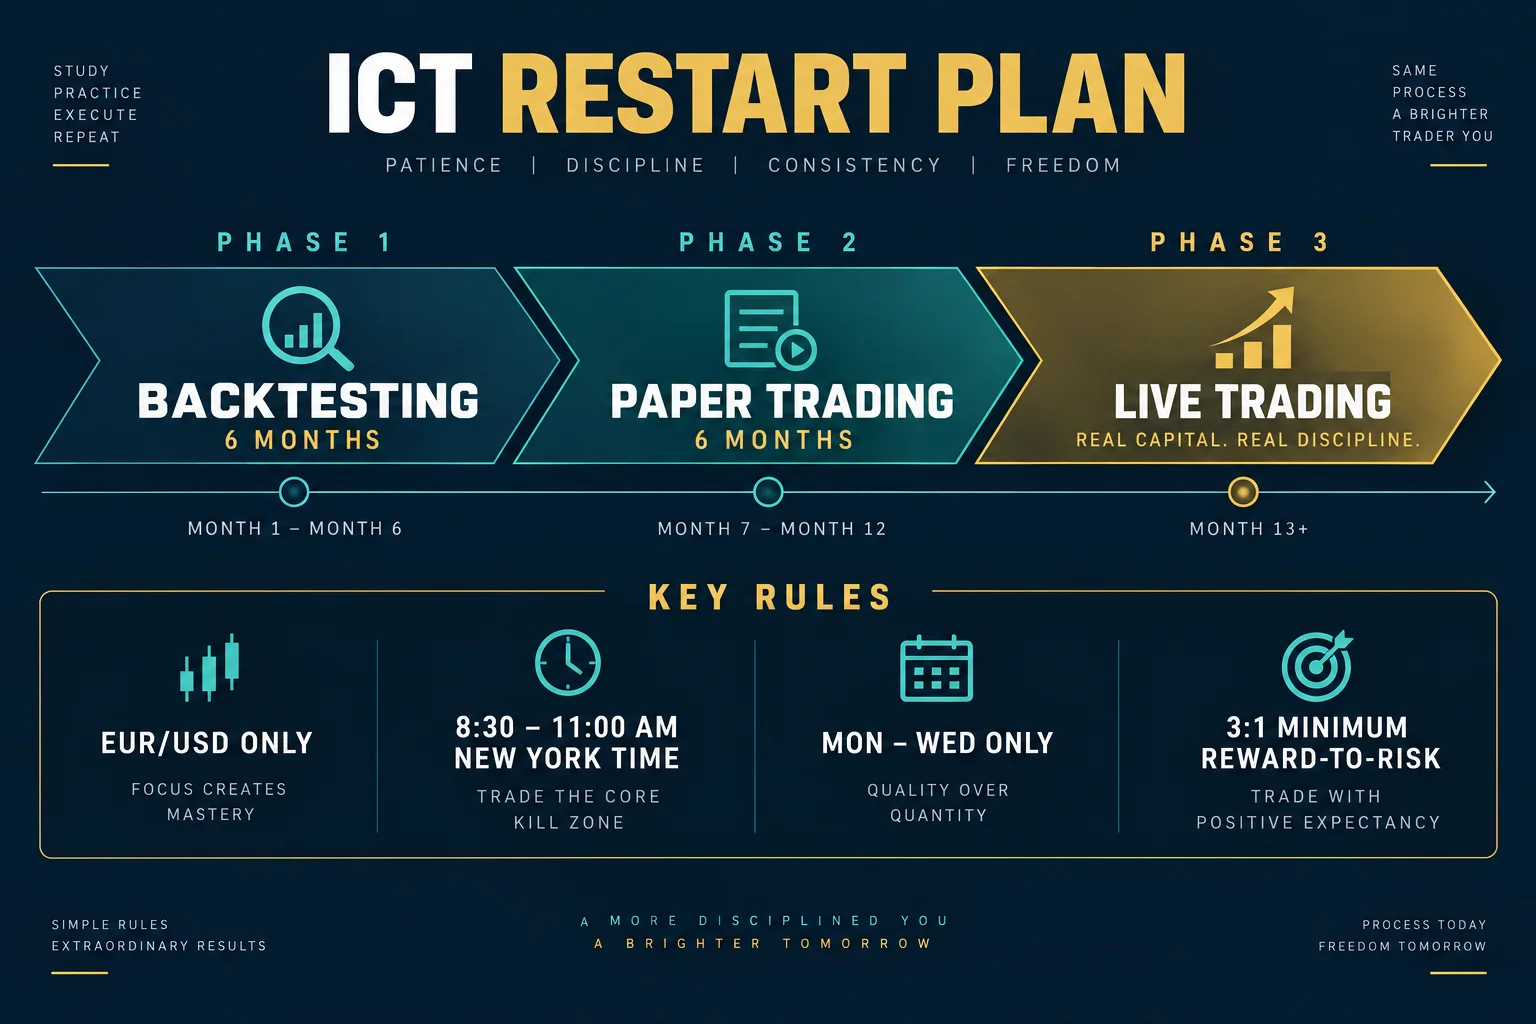
ICT Restart Plan Begins With Six Months of Backtesting
ICT begins by assuming the student has already spent six months backtesting and logging examples of the OTE pattern. At 00:24, he says that this prior work should build familiarity with setups appearing between 8:30 a.m. and 11:00 a.m. New York local time.
This is not presented as a shortcut for someone encountering OTE for the first time. ICT directs beginners to his separate OTE primer and pattern-recognition material before attempting to apply the Part 3 example. The journal is meant to document both successful and failed examples rather than collect only attractive hindsight charts.
ICT Trade Plan for a Bullish OTE Setup
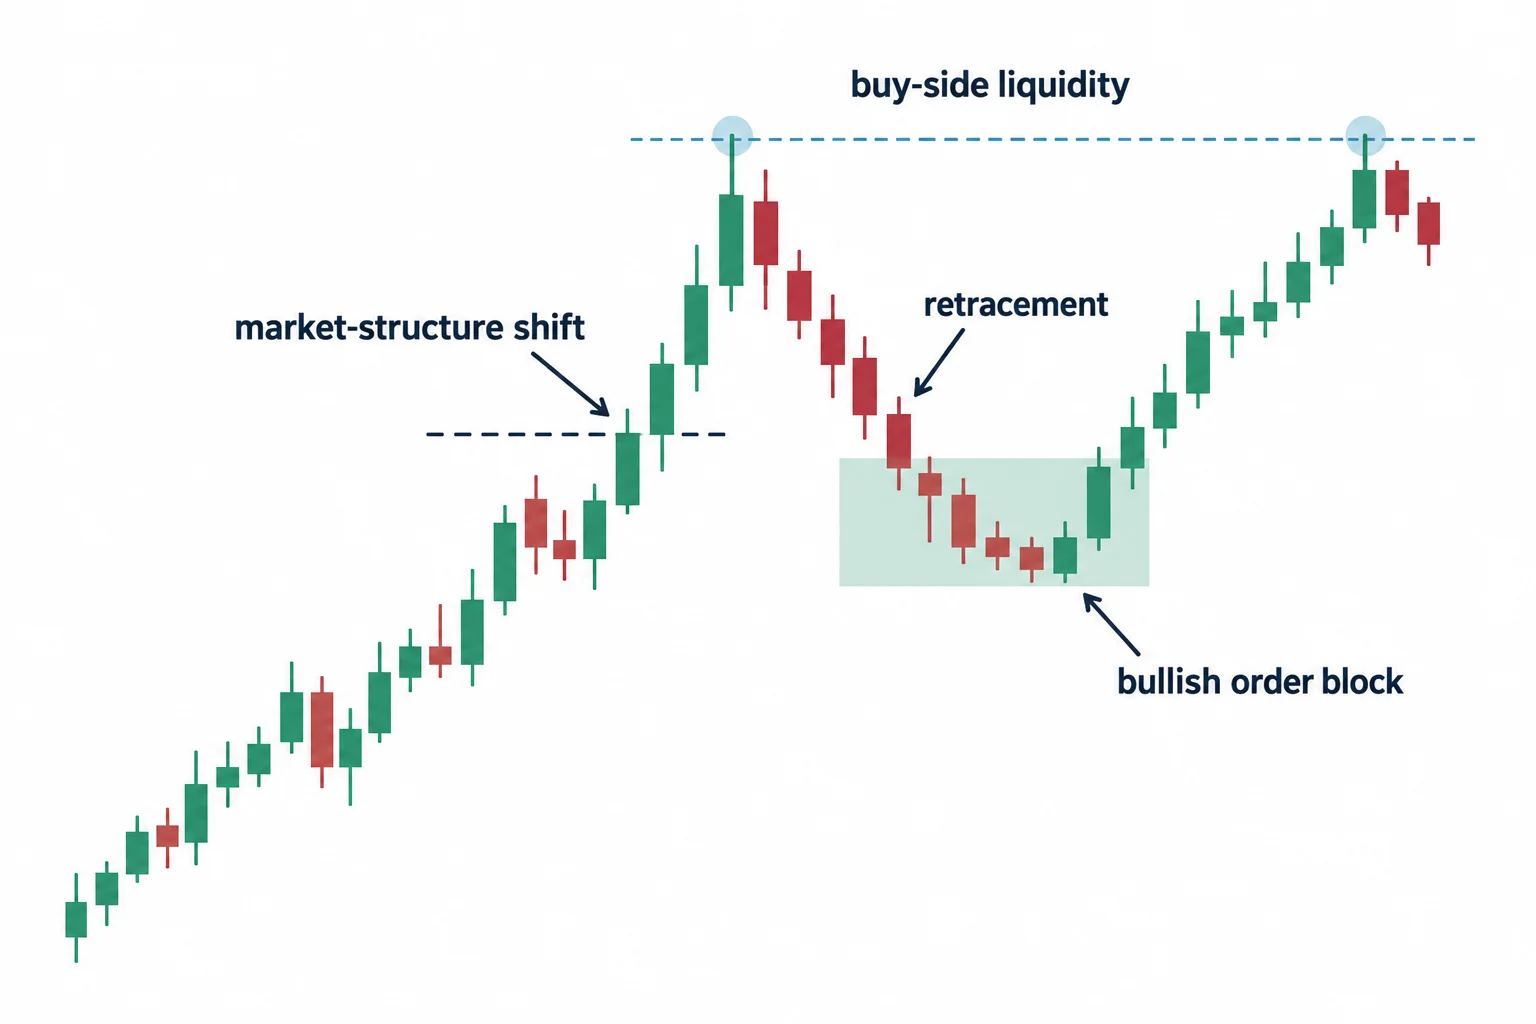
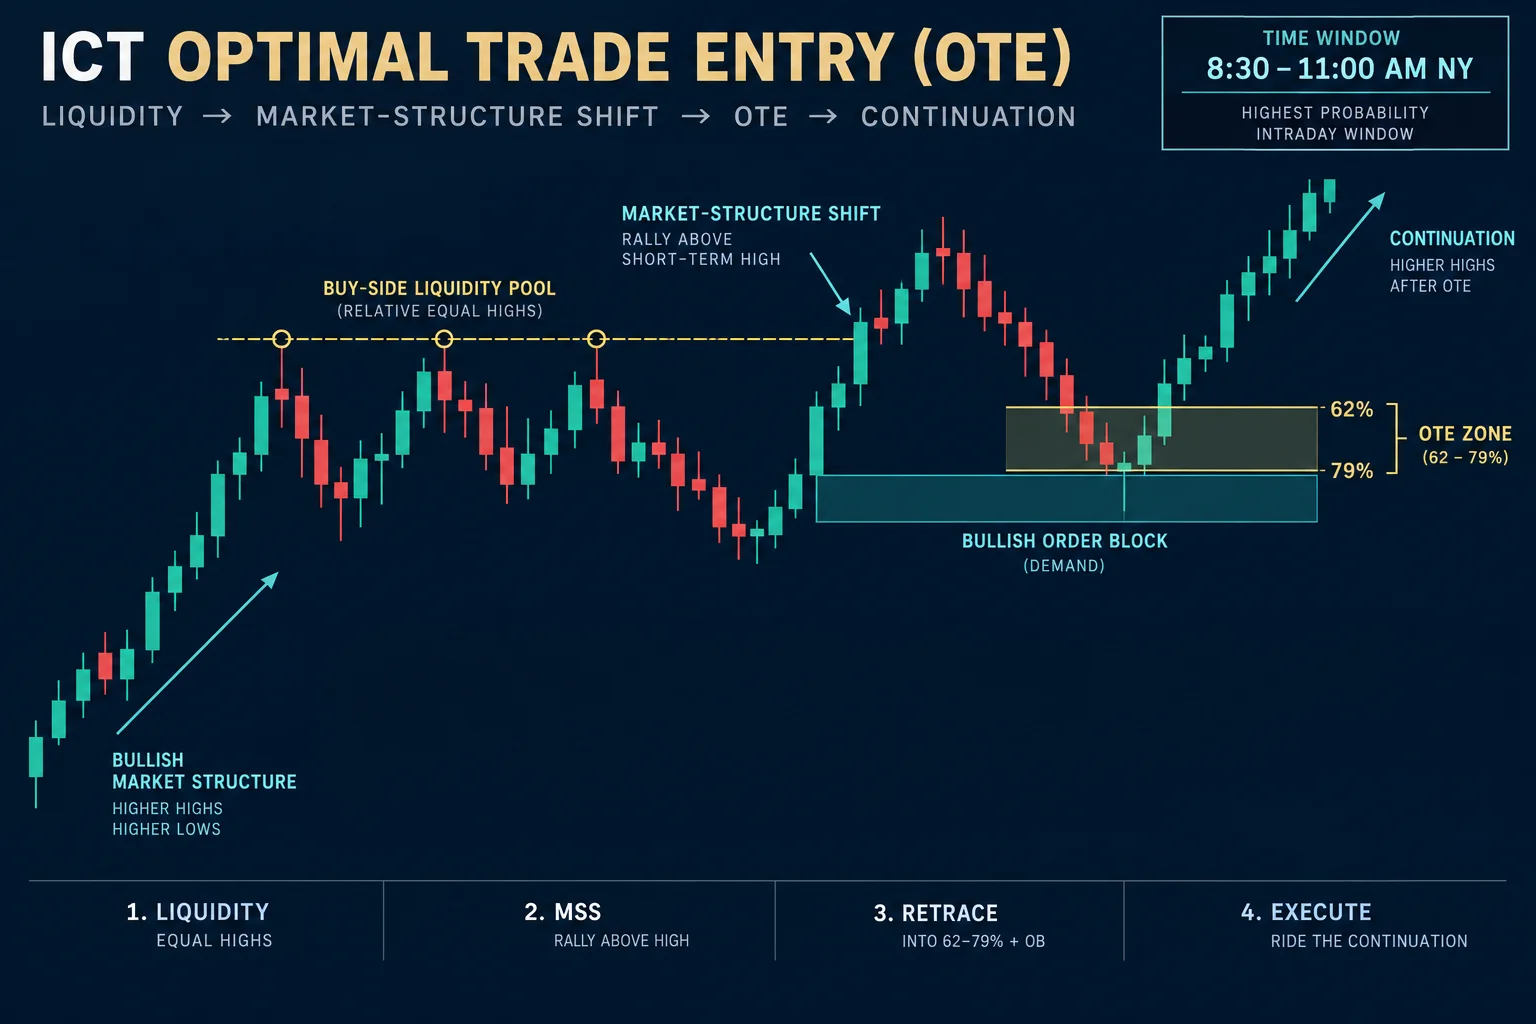
Beginning near 02:38, ICT describes an hourly EUR/USD chart with what he calls relative equal highs. In his framework, stops resting above those highs represent potential “buy-side liquidity.” He interprets that area as a possible destination for price rather than treating the highs only as conventional resistance.
His bullish sequence contains several connected conditions:
- The broader structure and momentum are interpreted as bullish.
- Price rallies through a short-term high, which ICT labels a market-structure shift.
- Price retraces into the 62%–79% region of the selected dealing range.
- The retracement overlaps a bullish order block, defined here through preceding down-close candles.
- Untouched highs remain above price as a potential target.
- The setup occurs during the specified New York morning window.
At 16:25, ICT stresses that Fibonacci levels are a visual aid rather than the entire signal. In his interpretation, an OTE is “optimal” only when the retracement aligns with structure, directional context, a proposed liquidity target and time of day. Merely buying every 62% or 79% pullback would omit most of the framework he describes.
ICT Order Blocks Across Multiple Time Frames
The lesson moves from the hourly chart to 15-minute and five-minute views. Around 18:18, ICT explains how he looks for overlap between the retracement zone and a bullish order block. At 22:13, he presents order blocks as fractal: the same type of structure may appear inside a larger setup on progressively lower time frames.
ICT says that the ideal OTE entry had already occurred before he opened the chart. He therefore based the illustrated paper entry on a later return to an order block within the broader bullish context. That distinction is useful: the video does not suggest that every later pullback is automatically interchangeable with the original entry.
ICT Trade Plan Uses the Three-to-One Filter
ICT’s minimum filter is a prospective reward three times the defined risk. Around 20:06, he distinguishes between a nearby short-term high and the more distant relative equal highs on the hourly chart. A developing trader, he says, does not need price to reach the furthest narrative target if an earlier exit can satisfy the planned three-to-one objective.
He also recommends learning partial exits gradually. The beginner could first practise closing a position ahead of an anticipated high. With experience, the trader might take a partial exit there and retain a smaller portion for a second target. Near 32:30, he calls this a two-stage or “double tap” exit: one partial and one final close.
The three-to-one threshold is a proposed selection rule, not proof of profitability. Actual expectancy would also depend on win rate, execution, spreads, slippage and whether the historical examples were selected consistently.
ICT Restart Plan for Simulated Trade Practice
The most concrete process guidance appears at 26:19. ICT proposes six months of historical study followed by another six months of forward testing in a paper or demo account. Under this plan, live funds would not be used during the first year.
He narrows the exercise further:
- Study EUR/USD rather than switching among many markets.
- Observe only 8:30–11:00 a.m. New York local time.
- Focus on Monday, Tuesday and Wednesday.
- Look for bullish setups when the weekly bias is bullish and reverse the logic when it is bearish.
- Require a plausible three-to-one opportunity; otherwise, let the setup pass.
- If no qualifying setup appears by Wednesday, record the observations and take no trade that week.
This restriction is explained at 30:23. ICT’s larger point is that doing nothing can still produce useful observational data. Missing an entry or finding no valid setup is not a reason to chase price outside the written window.
How to Use the ICT Restart Plan Safely
Independent of ICT’s market terminology, the video offers a structured deliberate-practice model: isolate one setup, define its context, collect failed as well as successful examples, rehearse decisions in simulation and delay financial risk. It also encourages separating a sound process from the outcome of any single trade.
However, the video’s career and wealth claims should not be treated as expected outcomes. A transcript and one narrated paper-trade example cannot establish repeatability, profitability or what happened outside the visible lesson. The source is best used to understand ICT’s stated framework and to formulate testable rules, not as investment advice or a performance guarantee.
Watch the Source Video
Related Resources
- ICT “If I Had To Restart Again As A Trader, At 20 Years Old – Part 2” — The preceding video in the restart series, covering trade management and stop placement rules that Part 3 references at 19:16 and 38:02.
- ICT OTE Primer – Introduction to Optimal Trade Entry — The beginner-level introduction that ICT directs new students to at 00:53 before attempting the Part 3 example.
- ICT Futures Commentary and Motivational Lecture: June 24, 2026 — A separate BestProps article on an ICT session covering process-over-payout discipline and study routines.
- CFTC Advisory: Understanding Commodity Trading Systems — U.S. federal guidance on evaluating trading system claims, relevant to assessing any paper-trade demonstration.




