Key takeaways
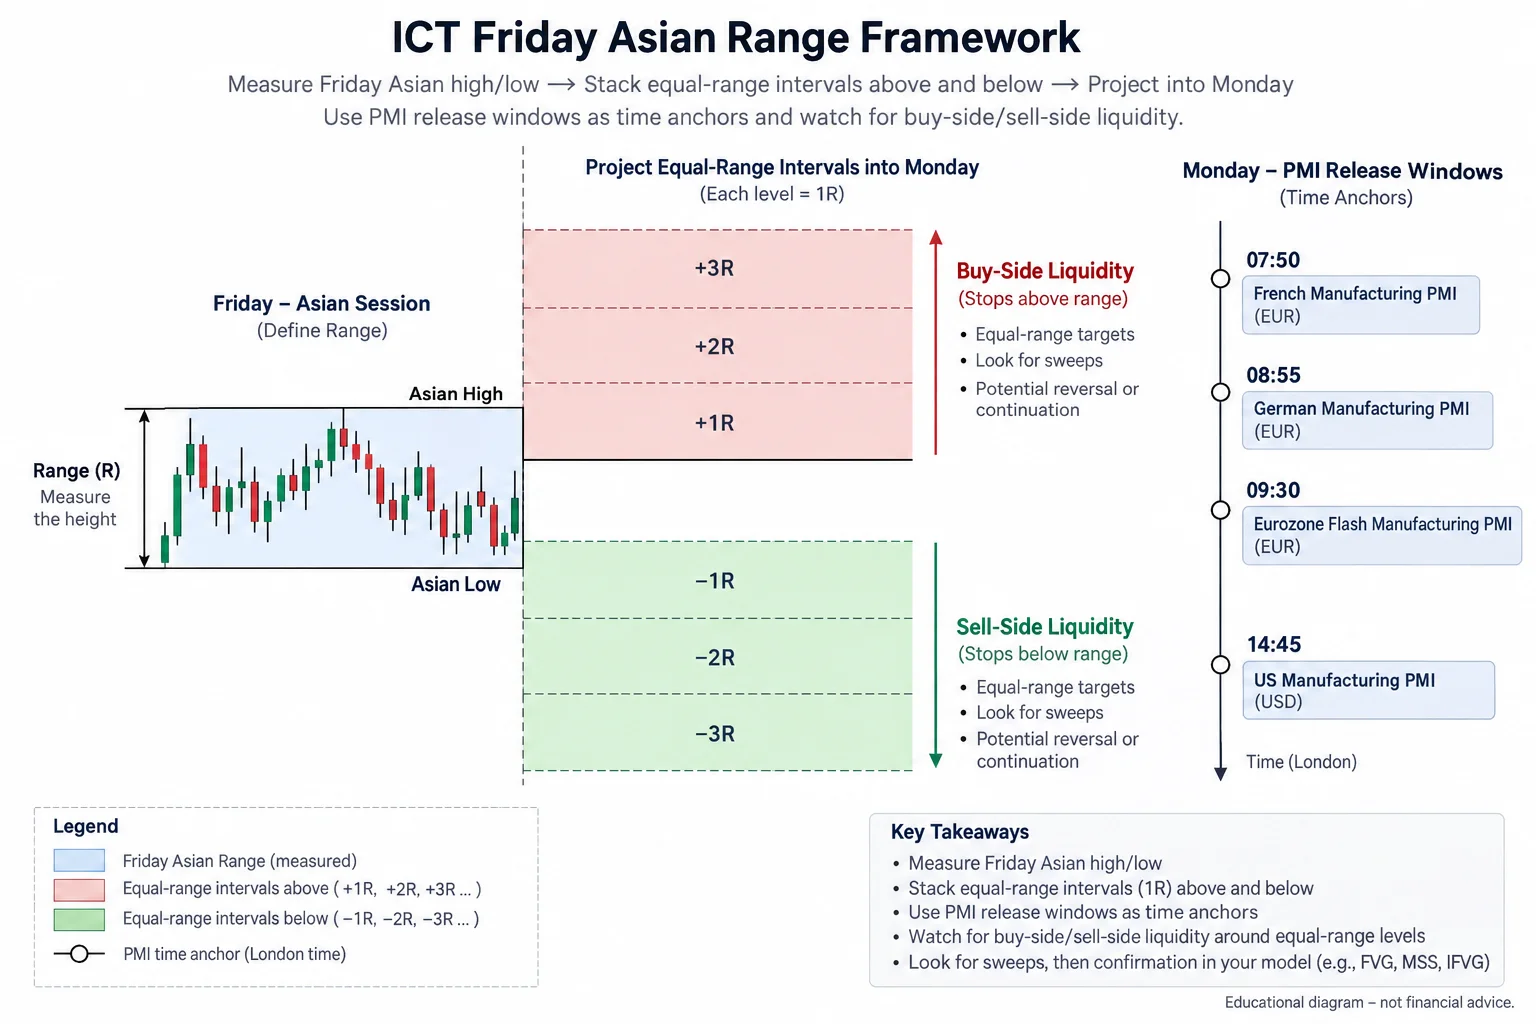
ICT’s November 24, 2020 forex lecture analyzes EUR/USD on November 23 by carrying the prior Friday Asian-session high, low, and total range into Monday, then projecting one equal range above and one, two, and three ranges below.
Read the full summary
ICT’s November 24, 2020 forex lecture analyzes EUR/USD on November 23 by carrying the prior Friday Asian-session high, low, and total range into Monday, then projecting one equal range above and one, two, and three ranges below. Monday’s high reportedly aligned near the first upper projection before price reversed toward the third lower projection. ICT prioritizes time and price together, focusing on the New York open kill zone around 7 a.m. and the nine forty five a.m. US release, with US manufacturing PMI at 56.7 versus 52.5 forecast, German manufacturing PMI at 57.9 versus 56, broader flash manufacturing at 53.6 versus 53.2, and French services weaker than forecast. He interprets highs above Friday’s range as buy-side liquidity and lows below prior swings or relative equal lows as sell-side liquidity, while recommending defined risk rules, reduced exposure near projections, and willingness to skip Mondays or thin holiday sessions. The lecture is a retrospective educational framework rather than proof of causation or a repeatable edge, and it provides no multi-sample test, alternative comparison, performance record, or complete execution data.
How we researched this article
BestProps used document-based research from primary firm sources, checked September 25, 2026. The complete source list, scope, limitations, and commercial-state record appear near the end of this article.
In ICT Forex Lecture: Revisiting The Friday Asian Range, uploaded November 24, 2020, ICT reviews EUR/USD price action around the November 23 economic calendar. His central argument is that Monday’s movement could be interpreted using the previous Friday’s Asian-session range, projected above and below its original boundaries.
This article explains what ICT presents in the lecture. His claims about algorithmic behavior, market control, and the precision of these levels are his interpretations, not independently established findings or evidence of a repeatable trading edge.
ICT Forex Lecture Economic Calendar Context
ICT begins by reviewing French, German, euro-area, and US purchasing managers’ index releases. At 00:31, he identifies several releases affecting the euro and US dollar during the London and New York portions of the day.
His comparison focuses on actual figures versus forecasts:
- The French services figure was described as weaker than forecast.
- German manufacturing PMI was reported as 57.9 against a forecast of 56.
- A broader flash manufacturing figure was reported as 53.6 versus 53.2.
- US manufacturing PMI later appeared at 56.7 versus a forecast of 52.5.
ICT says the better-than-forecast European figures could initially be read as supportive of the euro. He then contrasts them with the larger positive US surprise later in the day. His broader lesson is that a headline’s conventional bullish or bearish interpretation should not be considered in isolation.
This discussion does not establish that the releases caused the chart movements. Rather, ICT uses their timing to frame his reading of the session.
Why ICT Uses the Friday Asian Range
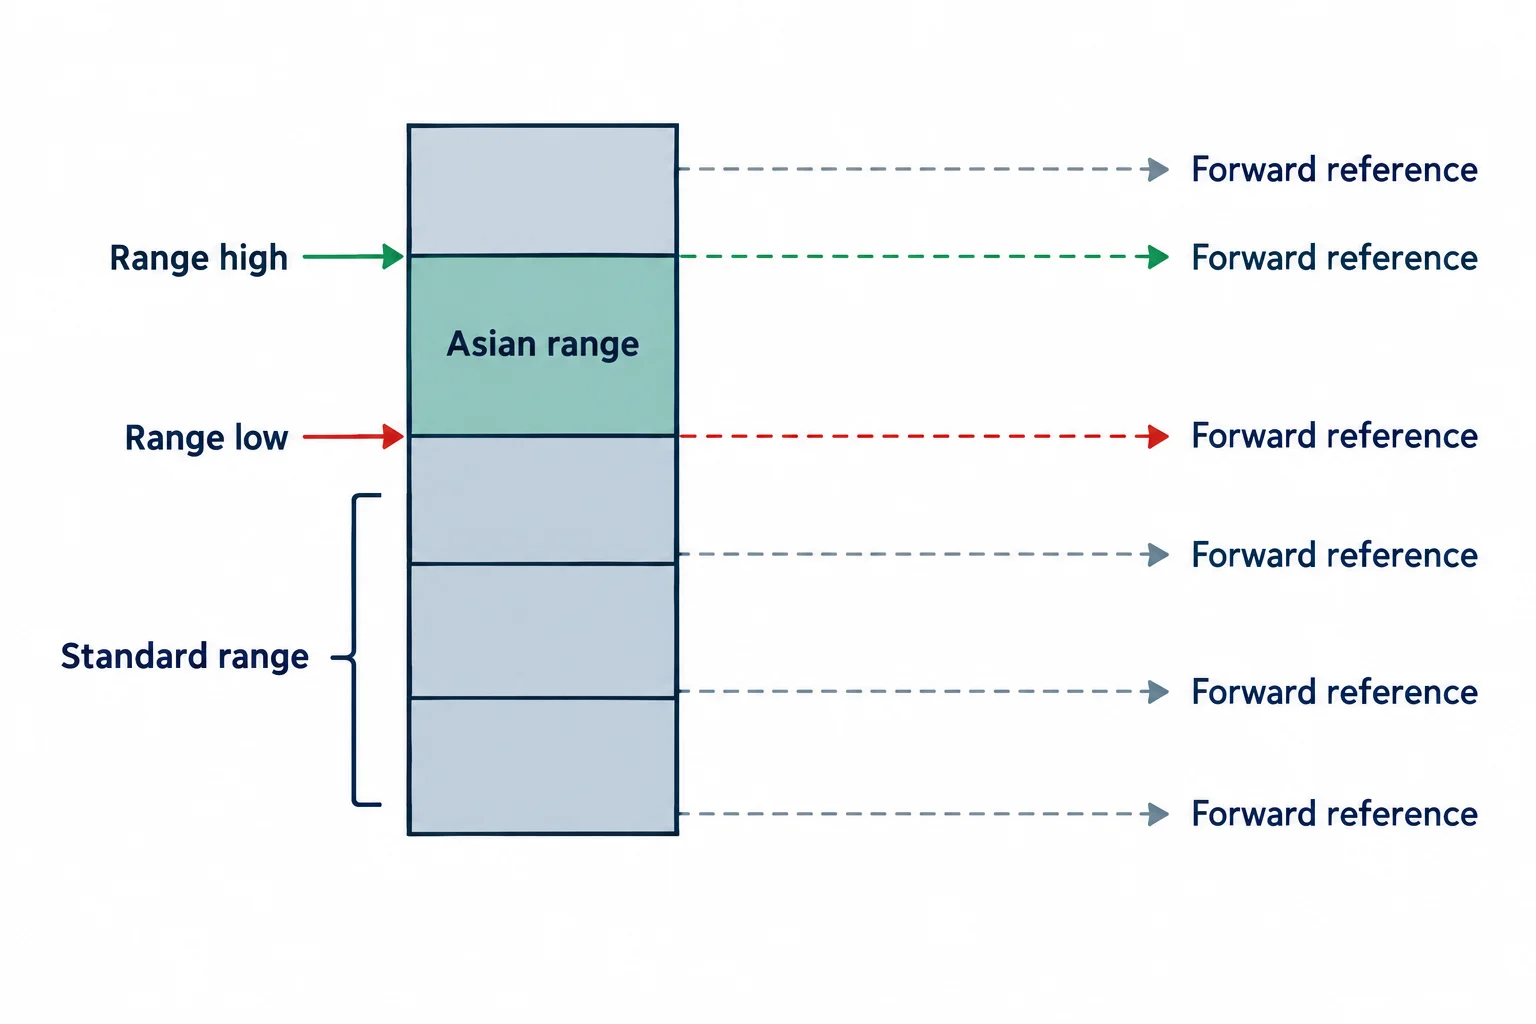
The main chart lesson starts around 04:24. Instead of calculating a new Asian range for Monday, ICT carries forward the Asian range measured on the previous Friday. He marks Friday’s high and low, then extends range-sized intervals above and below the Asian-session boundaries.
In the terminology of the lecture, one “standard range” is the height of that Asian range. The same distance is stacked repeatedly:
- one range above the original boundary;
- one, two, and three ranges below it; and
- all levels extended forward into the next trading week.
ICT states that Monday’s high aligned closely with the first upper projection and that the decline approached the third lower projection. The captions contain very precise price readings and the term “pipettes,” but those details should be checked against the chart because the captions are automatically generated and may have transcribed the decimals imperfectly.
How ICT Range Timing Aligns With Price
At 06:58, ICT describes the exercise as measuring price relative to time rather than applying a conventional indicator. In his framework, a projected price level is not enough by itself. A relevant time window must also be present.
He gives priority to time: if the anticipated behavior does not occur during the specified window, he says there is no setup regardless of what price appears to be doing. He associates the approach toward the upper projection with the period around 7:00 a.m. New York time, which he calls the New York open “kill zone.”
Later, at 10:36, he points to the 9:45 a.m. US release and interprets the subsequent downward displacement as occurring alongside the stronger-than-forecast dollar data. In his account, price first moved above Friday’s high and reached the upper range projection, then reversed toward liquidity beneath prior lows and the lower projected ranges.
ICT Forex Range Liquidity and Reversals
ICT describes highs above Friday’s range as “buy-side liquidity” and lows beneath prior swing points or relative equal lows as “sell-side liquidity.” Beginning near 12:45, he argues that traders might have interpreted the consolidation above Friday’s high as a bullish continuation pattern. His alternative reading is that the move above those highs preceded a run toward liquidity below Friday’s lows.
This is a retrospective explanation of the chart shown in the recording. The transcript alone does not reveal every candle, spread, executable price, order, or fill, and it cannot demonstrate what a viewer could have identified in real time.
ICT Forex Lecture Risk Management Lessons
Although much of the presentation emphasizes the projected levels, ICT also discusses uncertainty and trading discipline. He says he generally dislikes trading Mondays because they can help establish the structure of the weekly range. He presents skipping a session as a rule-based choice rather than assuming every day must produce an opportunity.
He also advocates having a defined process to reduce reactions driven by fear and greed. In the example, he describes reducing exposure near the upper projection rather than assuming the initial euro rise must continue. That is ICT’s educational interpretation of the example, not individualized investment advice.
At 13:51, he stresses what he regarded at the time as elevated event and liquidity risk. Earlier, he characterizes the US Thanksgiving week as a potentially thin trading period in which repricing could be abrupt. The general educational point is that holiday conditions, scheduled announcements, and unexpected events can complicate chart-based expectations.
How to Study the ICT Friday Range Lecture
For chart study, the lecture can be reduced to a testable annotation exercise:
- Identify the prior Friday’s Asian-session high, low, and total range using a clearly defined timezone.
- Extend those boundaries into Monday.
- Project equal range increments above and below them.
- Mark Friday’s overall high and low, plus obvious prior swing points.
- Record scheduled economic releases and the time windows emphasized in the lecture.
- Review whether price interacted with the projected levels, while also documenting misses and ambiguous cases.
The final step matters because one illustrated match cannot establish reliability. ICT presents the chart as support for his time-and-price theory, but the video does not supply a multi-sample test, comparison against alternatives, or performance record. The most defensible use of the lecture is therefore as a precise description of ICT’s framework and a starting point for critical historical study.