
Key takeaways
ICT’s November 3, 2017 GBP/USD commentary explains a discretionary bearish setup built from price near the top of a broad consolidation, a Turtle Soup false breakout above an earlier high, an hourly bearish market-structure break, and retracements refined on 15-minute and five-minute charts.
Read the full summary
ICT’s November 3, 2017 GBP/USD commentary explains a discretionary bearish setup built from price near the top of a broad consolidation, a Turtle Soup false breakout above an earlier high, an hourly bearish market-structure break, and retracements refined on 15-minute and five-minute charts. He treated RSI, stochastic, and Williams %R as optional confirmation rather than the basis of the thesis, projected multiple downside objectives, and considered possible US Dollar Index strength and the approaching US nonfarm-payroll release. After waiting for added confirmation because of the British bank-rate announcement, he entered short from his phone near a candle-body-based optimal trade entry range, slightly outside the London kill zone, targeting an earlier low. He exited when price hesitated ahead of that low rather than hold through scheduled news, prioritizing exposure control over capturing the full decline. The account is retrospective educational commentary, and the transcript cannot independently verify chart markings, price levels, fills, results, or a repeatable trading edge.
How we researched this article
BestProps used document-based research from primary firm sources, checked September 25, 2026. The complete source list, scope, limitations, and commercial-state record appear near the end of this article.
In “Post GbpUsd Rate Announcement Commentary”, uploaded on November 3, 2017, ICT reviews his reading of GBP/USD (often called “cable”) around a British bank-rate announcement. The lesson moves from a broad trading range to hourly, 15-minute, and five-minute charts, explaining how he framed a bearish idea and managed exposure around scheduled news.
This is a retrospective explanation of ICT’s own market interpretation. The transcript alone cannot verify the chart markings, quoted prices, order fills, or what happened after the portion shown. It should therefore be read as educational commentary rather than evidence that the method provides a repeatable edge.
ICT GBPUSD Range Before the Rate Announcement
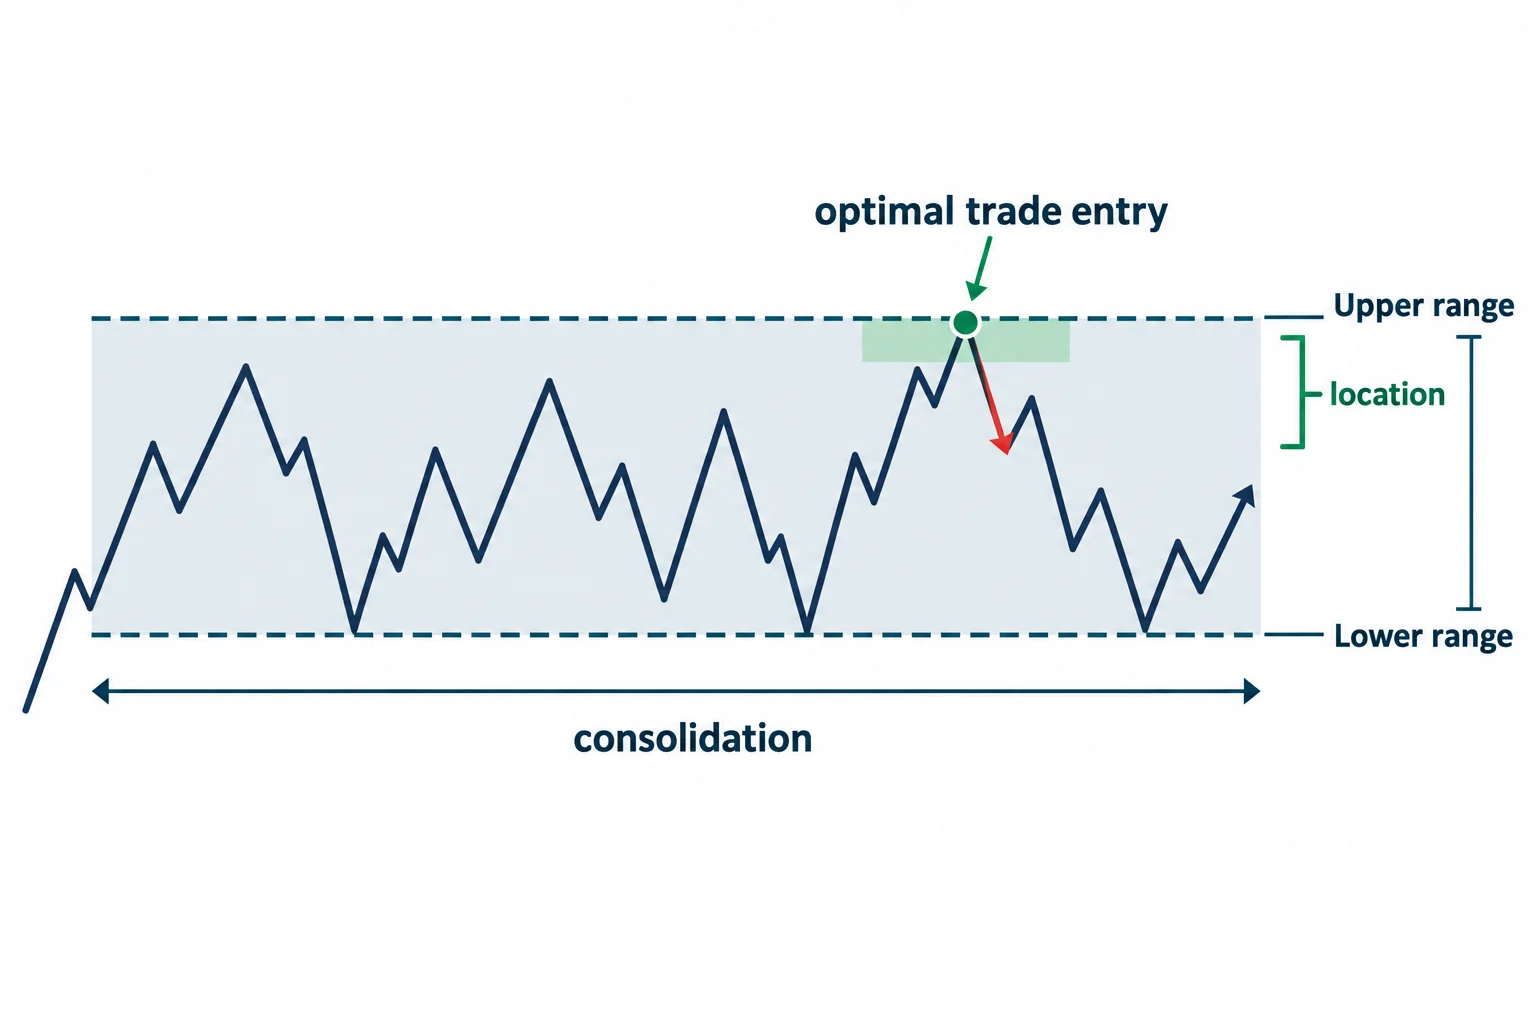
ICT begins by defining a swing and projecting what he calls an “optimal trade entry” area. At 0:50, he says this projection creates a range and places the proposed entry area near its upper portion.
That location is central to his analysis. Because GBP/USD was consolidating, he argues that a trader could identify relatively high and low areas directly from price structure. He briefly displays an overbought reading from an oscillator, but his stated point is that RSI, stochastic, or Williams %R was not necessary to recognize that price was near the top of the range. See the discussion beginning at 0:57.
In general educational terms, this is a distinction between location and indicator confirmation. ICT’s preference here is to establish location from the boundaries of consolidation first. The oscillator is presented only as a secondary illustration, not as the basis of the bearish thesis.
ICT GBPUSD Targets After the Rate Announcement
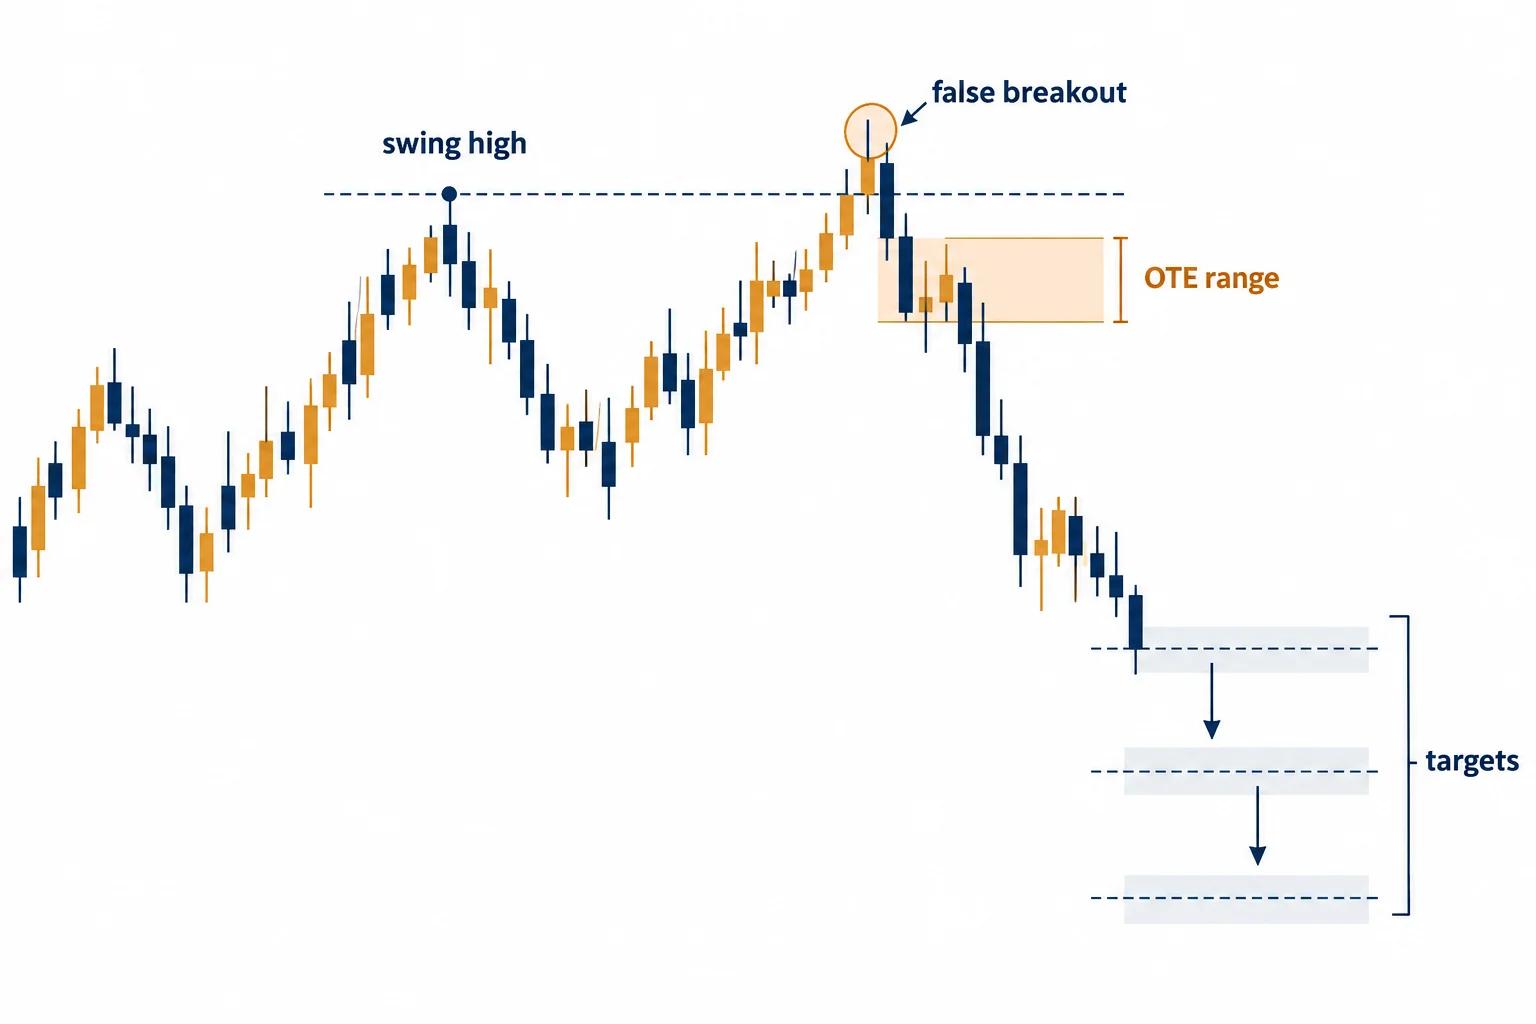
At 1:41, ICT introduces several downside objectives while noting the approaching US nonfarm-payroll release. He also connects the potential depth of a GBP/USD decline to the strength of a possible rally in the US Dollar Index.
The automated transcript contains several spoken price levels, but their decimal placement is not consistently reliable. More importantly, the recording’s charts are not available for independent inspection through the transcript. The supported teaching point is that ICT had multiple projected objectives rather than one unconditional destination. He considered the deepest projection possible but said he did not expect it to be reached in the next session.
ICT GBPUSD False Breakout and Trade Shift
The next part of the review focuses on an earlier high. ICT describes price trading above that high and then reversing, which he labels a “Turtle Soup” scenario (a term he uses here for a false breakout). He introduces that interpretation at 2:38.
On the hourly chart, he then identifies a break lower in market structure. His interpretation was that subsequent rallies should be treated with suspicion: instead of signaling renewed strength, they might represent distribution before another decline. That reasoning appears at 3:03.
ICT also says the scheduled rate announcement made him reluctant to act before price provided additional bearish confirmation. This caveat matters. Although his directional framework was already bearish, he describes the event risk as a reason to demand more evidence rather than assuming that the anticipated move would occur.
Refining the ICT GBPUSD Trade Setup
Moving to a 15-minute chart, ICT describes an initial decline, a rally beginning around the Asian session, consolidation, and another break lower. At 3:46, he explains that he used a particular high and low to establish the narrower optimal-trade-entry range he was monitoring.
He then moves to the five-minute chart and refines the range using candle bodies. According to his account, price rallied into that area and he entered short from his phone. He acknowledges that the timing was slightly outside what he calls the London “kill zone,” but says his expectation was still for a decline toward an earlier low. The entry rationale begins at 5:13.
The broader analytical sequence can be summarized as follows:
- Identify where price sits within a larger consolidation.
- Note a failed move above an earlier high.
- Wait for a lower-time-frame break that supports the bearish interpretation.
- Use a retracement into a defined range to frame the entry.
- Look toward prior lows while accounting for scheduled-event volatility.
This sequence describes ICT’s framework in the video; it is not an independently tested trading rule.
Why ICT Exited the GBPUSD Trade Early
The most useful part of the commentary concerns the difference between analysis and trade management. Around 6:11, ICT says he wanted to exit ahead of an older low rather than insist on capturing the exact target. When price hesitated, the impending bank-rate announcement led him to close instead of continuing to hold through the event.
He later observes that price made another move lower, retraced deeply, and then declined again. In his assessment, leaving early was still appropriate because his priority was controlling exposure to the announcement. He explicitly notes that he did not capture the high or the low, only part of the movement.
Near the end, ICT also says a lower level he had shared was missed by a small amount, although he believed his directional expectation had been correct. That statement is his retrospective account; the transcript does not independently establish the posted level, execution, or result.
Key Lessons From ICT GBPUSD Trade Commentary
The video’s main lesson is not simply a bearish GBP/USD call. It is a top-down narrative combining range location, a failed breakout, a claimed market-structure shift, and a lower-time-frame retracement. Just as importantly, ICT presents event risk as a reason to reduce ambition and exit before a scheduled announcement rather than attempting to capture every part of a move.
These concepts are subjective and depend heavily on chart selection and discretionary interpretation. The video is best used to understand how ICT explained this particular session, not as investment advice or a promise of similar results.




