
How we researched this article
BestProps used document-based research from primary firm sources, checked September 25, 2026. The complete source list, scope, limitations, and commercial-state record appear near the end of this article.
In Pattern Recognition – NYO Fiber Long Order Block & OTE, ICT narrates a EUR/USD long scalp built around a bullish order block, liquidity above a prior high, and an anticipated expansion during the New York session. The lesson is less about a standalone entry signal than about recognizing a sequence: retracement into a predefined area, reaction from that area, and a move toward liquidity.
The transcript records ICT’s interpretation of one session. It does not independently establish that order blocks predict price movement, and the chart itself cannot be verified from the audio transcript.
The setup: retracement before expansion
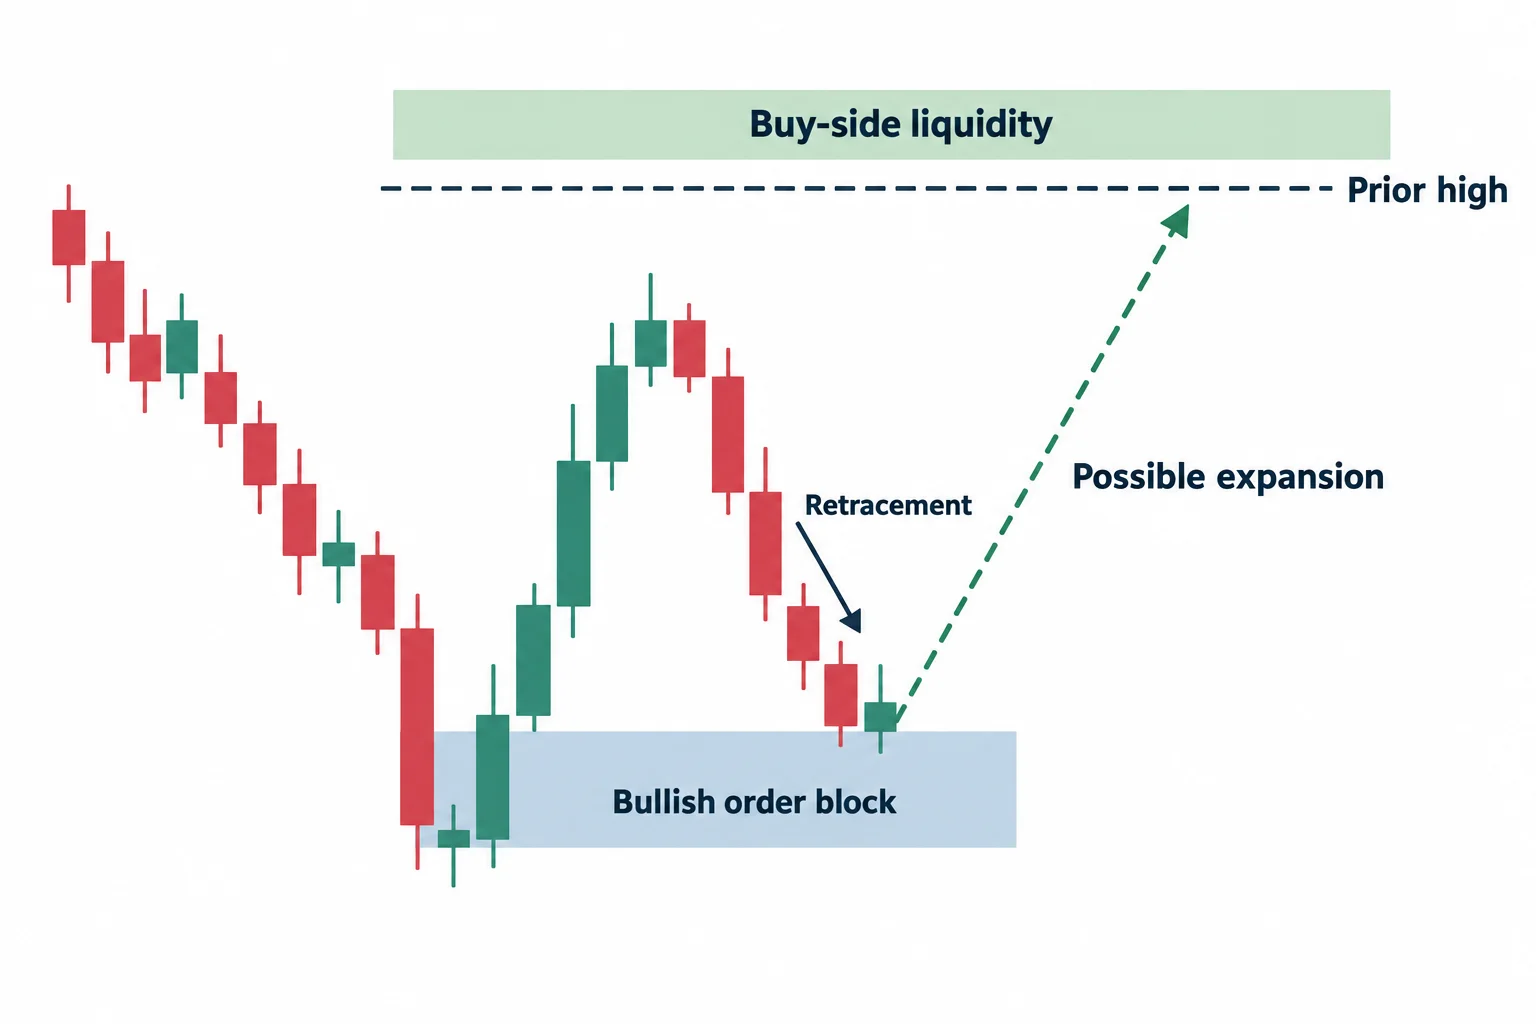
At 0:17, ICT says he expects the previous day’s high to be exceeded. He then identifies liquidity above the 1.18 large round-number area and describes 1.1792 as an initial level of interest. His plan is to participate after a retracement around 7:00 a.m. New York time rather than chase an already advancing market.
ICT characterizes the retracement as a return to a bullish ICT order block. In his terminology, this is a price area associated with a prior downward candle or short-term decline before an upward displacement. He waits for what he calls “expansion”: candles beginning to move decisively toward the identified high and possible buy-side liquidity above it.
The pattern ICT wants viewers to recognize
- A directional expectation that the prior day’s high may be taken.
- A retracement into a previously identified bullish order-block area.
- A reaction from that area rather than an immediate breakdown through it.
- Expansion toward an intraday high, the previous day’s high, and potential stops above those levels.
At 1:31, he points to what he considers the first favorable response from the area. The automatic transcript alternates between “bull shoulder block” and “bull short block,” but these are likely recognition errors for “bullish order block.” The exact chart boundaries are not available in the transcript.
Why ICT does not treat the prior high as a simple sell level
Beginning around 2:03, ICT contrasts his liquidity-based reading with a conventional support-and-resistance response. He argues that some traders may sell near a previous high because an indicator appears overbought or shows bearish divergence. In this example, however, he continues to favor the bullish scenario.
He also describes an 8:30 news-related decline that, in his account, returned to the same bullish order-block area. At 2:40, he says price touched that level again without moving below it and labels the location another potential buy. He explicitly says he did not take that additional entry.
The broader educational point is that an “overbought” reading alone does not determine where price must reverse. ICT instead frames the prior high as a possible liquidity objective. That is his market interpretation, not proof that indicators are ineffective or that a liquidity model will consistently forecast direction.
Scaling out and tightening risk
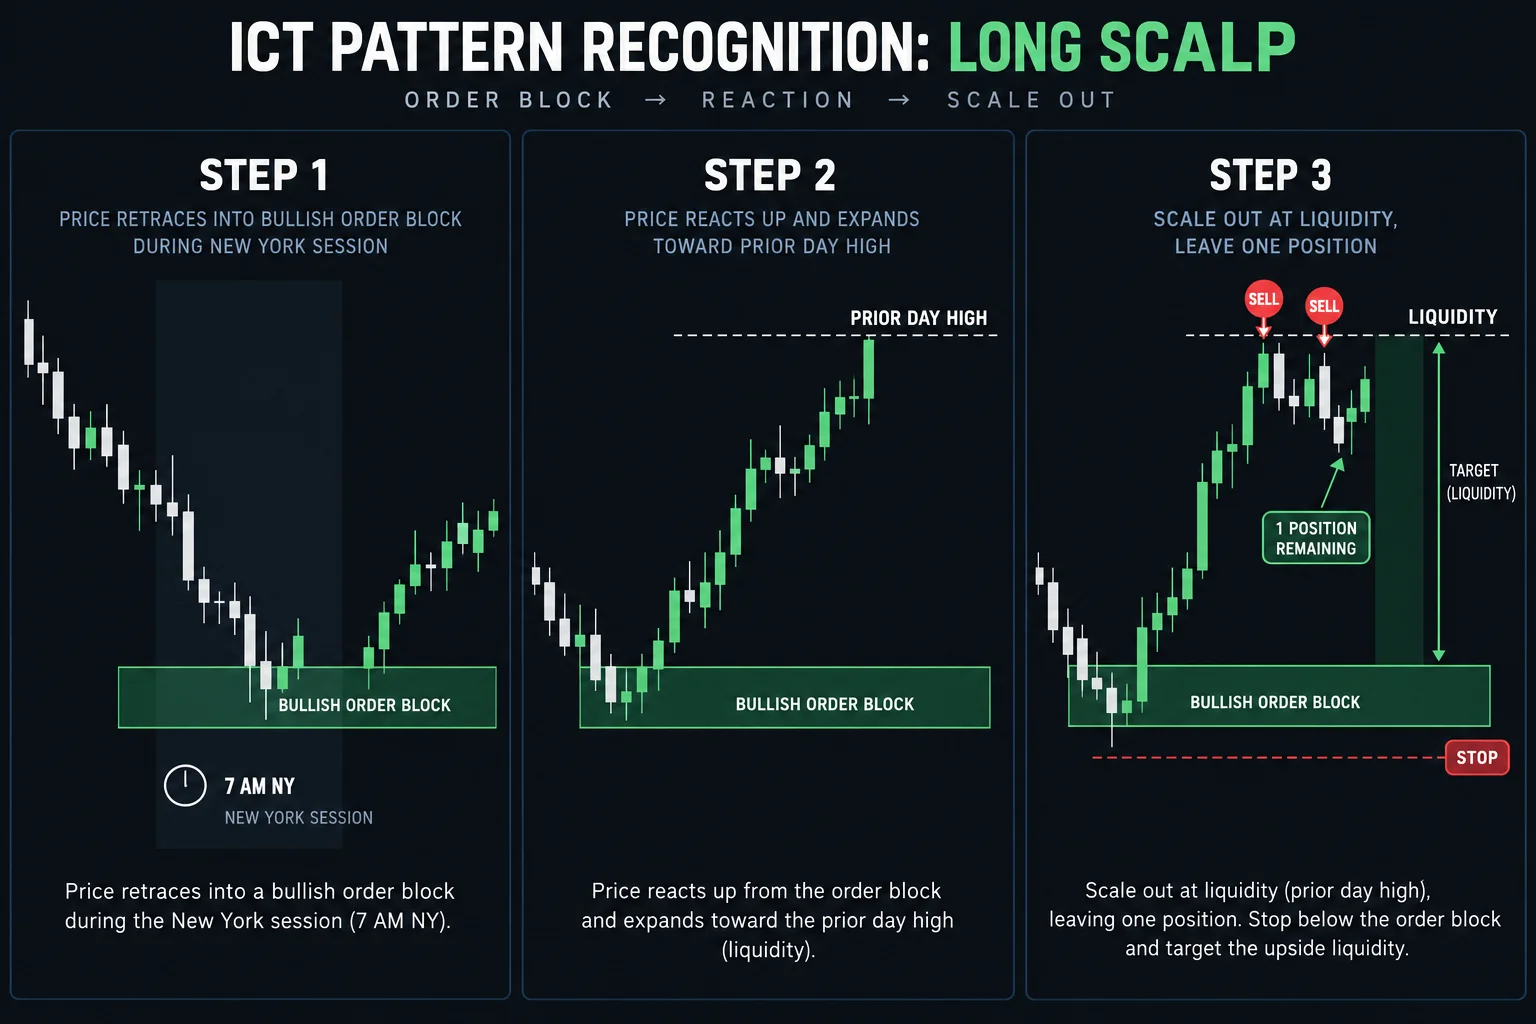
At 3:52, ICT narrates a rally and says he has orders positioned to remove two of three lots above the previous day’s high. He reports scaling out after price trades above that high, leaving one lot open and moving the stop so the overall position could no longer become a loss according to his account.
He then mentions 1.1810 as a further objective and an order at 1.1820 in case of a favorable spike. These numbers are statements from the narration; the transcript alone cannot verify executions, spreads, chart prints, or account results.
The remaining position illustrates a practical trade-off. ICT says he tightened the stop aggressively because he did not trust EUR/USD to advance cleanly during the New York session and wanted to protect open profit. Around 5:18, he looks for the previous day’s high to act as support. He later acknowledges that the stop was too tight and says the final portion was stopped out.
What the example teaches—and what it does not
The session demonstrates ICT’s preferred order of analysis: form a directional premise, identify a liquidity objective, wait for a return to a bullish order block, and manage exposure as price approaches the objective. It also shows that a correct directional expectation, in his telling, does not guarantee ideal management of every remaining portion. He reports that price continued higher after his final stop was triggered, passing 1.1810 but falling short of 1.1820 (6:46).
Although “OTE” appears in the video title, the transcript does not contain a clear explanation of an optimal trade entry calculation or its usual retracement levels. Likewise, “NYO” is not explicitly defined in the narration, though ICT does refer to 7:00 a.m. New York time and the New York session. Those concepts should not be reconstructed from the title alone.
Watch the original ICT lesson
This article draws on the timestamped audio transcript of Pattern Recognition – NYO Fiber Long Order Block & OTE. The transcript is a source for the speaker’s words, not independent proof of the reported trading performance. The recording’s chart detail remains important when following the annotations.
Watch the original lesson on YouTube
The video cannot be played inside another website: its embedded player reports a YouTube Error 153 and settles on a “Watch video on YouTube” prompt. That message is the reason no embed is reserved here; the recording itself is available directly on YouTube.
Watch Pattern Recognition – NYO Fiber Long Order Block & OTE on YouTube ↗
Primary source and further reading
- The original Inner Circle Trader lesson: use the timestamp links in this article to compare the explanation with its source.
- YouTube’s embedding documentation: platform guidance relevant to the external watch link above.
- 17 CFR 4.41: disclosures concerning hypothetical performance: a regulatory reference, not a statement that a particular recording or this article meets every legal requirement.
This is independent educational commentary. It is not official ICT material, a tested trading system, or a claim that the reported results can be reproduced.




