
How we researched this article
BestProps used document-based research from primary firm sources, checked September 25, 2026. The complete source list, scope, limitations, and commercial-state record appear near the end of this article.
In this brief pattern-recognition drill, ICT reviews what he identifies as a bearish optimal trade entry (OTE) structure on a USD/JPY chart associated with the October 27, 2017 New York session. The lesson focuses on selecting a dealing range, applying Fibonacci retracement levels to candle bodies rather than wick extremes, and identifying a possible objective after a retracement.
Primary source: ICT Pattern Recognition Drill – OTE UsdJpy New York Session 10/27/17, uploaded October 29, 2017.
The first bearish OTE pattern
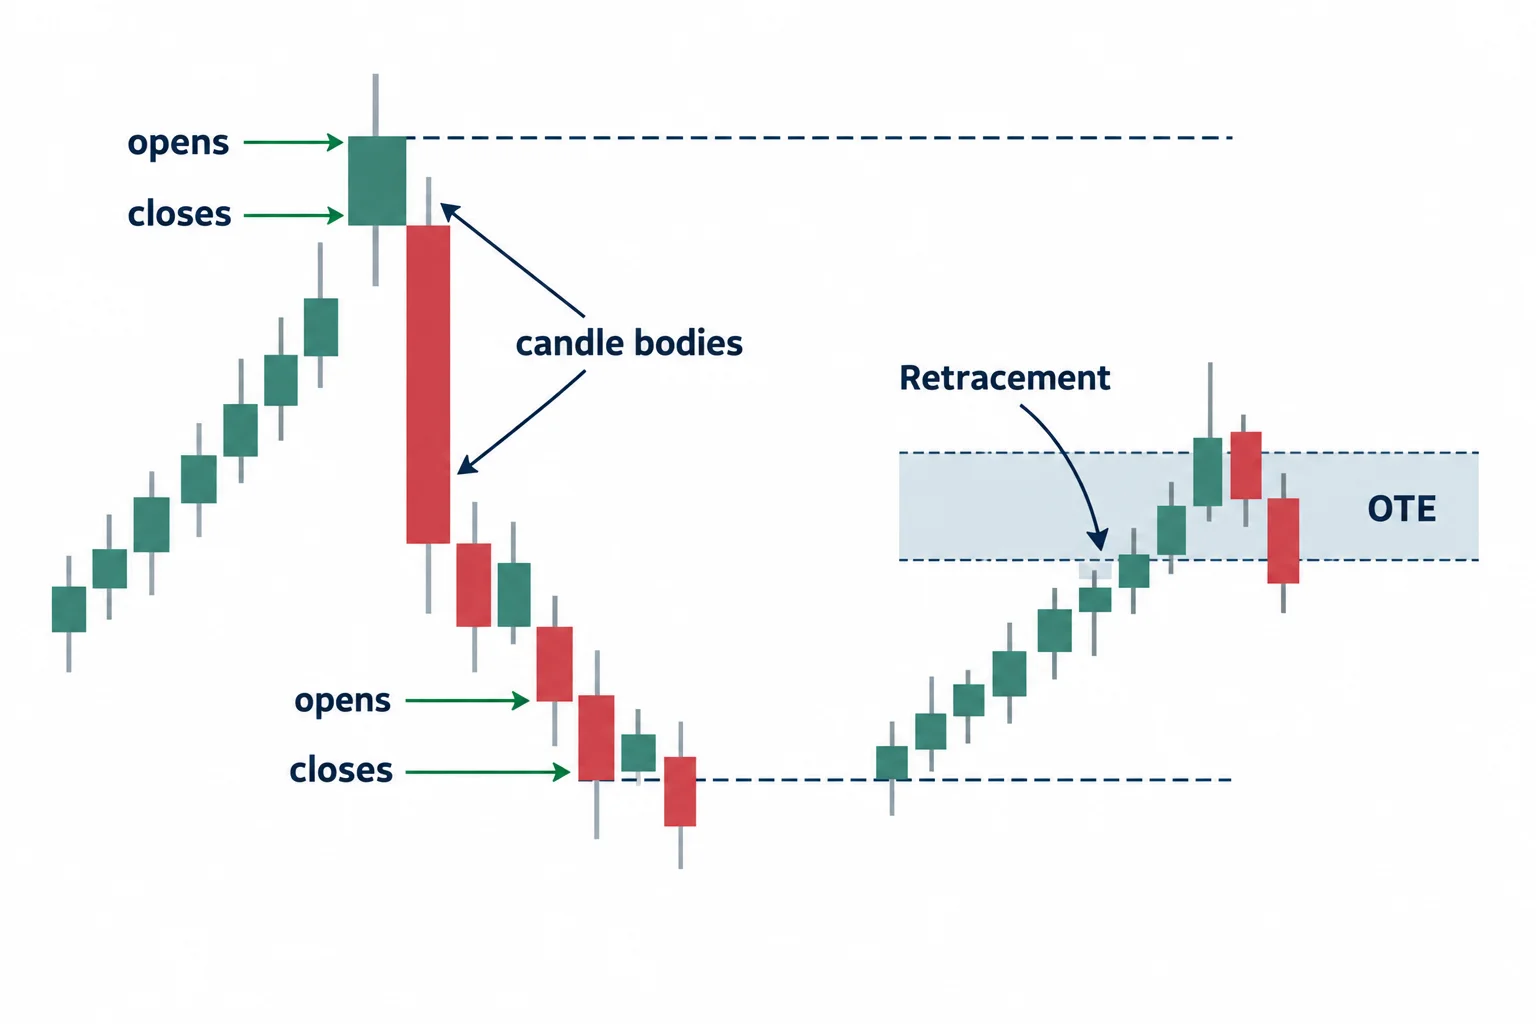
At 0:19, ICT labels the displayed formation an “optimal trade-entry short pattern” at its inception. Although he briefly mentions a buy-stop run, an “ICT breaker,” and the 114.15 level, he repeatedly says those features are not the subject of this particular drill. They are contextual observations rather than the lesson’s central setup.
The main explanation begins around 0:54. ICT describes drawing a Fibonacci range from a swing high toward a lower candle-body reference. More specifically, he says he uses the highest open or close and the lowest body-based open or close. In his interpretation, that measurement brings the retracement into the 62% area.
This detail matters because the demonstration is not presented as a simple wick-to-wick Fibonacci measurement. ICT is emphasizing opens and closes—the boundaries of candle bodies—as the anchors for this example. Because the source is an automated transcript and the chart itself was not independently inspected here, the exact candles and placement of the drawing cannot be verified from the spoken material alone.
Time spent near the retracement level
From approximately 1:15, ICT calls attention to a multi-candle formation and to how long price remains around the highlighted level. The automatic transcript renders one of his labels unclearly, so the safest supported takeaway is that he views both repeated candle interaction and time spent at the level as useful pattern-recognition details.
He then says price eventually moves through that horizontal area near the close of the day. This is a retrospective description of the chart in the lesson, not evidence that every 62% retracement will behave similarly.
A later setup and the 70.5% area
At 2:00, ICT distinguishes another formation from the principal New York-session example. He characterizes it as more of a London-close setup and includes it for completeness.
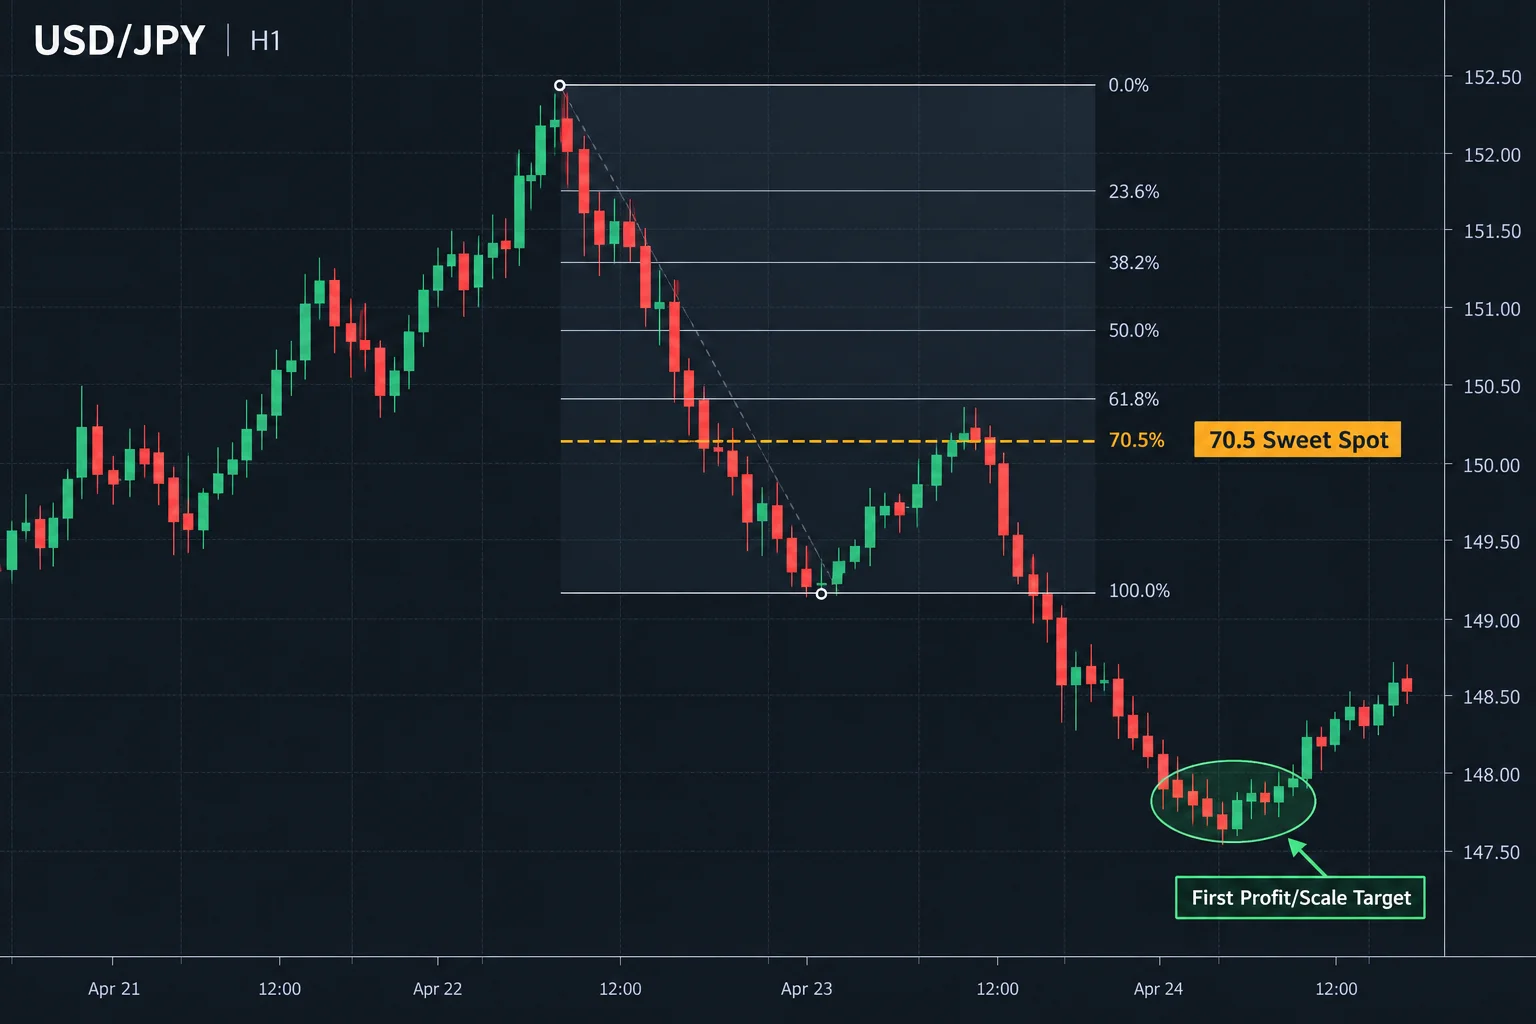
He then resets the chart presentation and offers an alternative measurement for someone who did not use the earlier pattern. Beginning around 2:18, he describes using another range down to the lowest candle body. According to ICT, this measurement reaches the 70.5% “sweet spot.”
At 2:38, he points to a lower area as a first objective where partial profit-taking or scaling could be considered. The transcript does not provide an exact objective price, position size, entry confirmation, stop placement, fill, or realized result. This portion is best understood as an illustration of trade-management logic within ICT’s example, not as a documented trade record.
Educational interpretation
The drill illustrates a repeatable chart-study process rather than a complete trading system:
- Identify the swing or dealing range relevant to the proposed short setup.
- Determine whether the exercise uses candle bodies rather than wick extremes.
- Observe the retracement around the 62% or 70.5% regions highlighted by ICT.
- Note how candles interact with the level over time.
- Define a lower reference area that could serve as an initial objective in the chart study.
The transcript does not provide enough information to reconstruct the complete chart, confirm an executed trade, establish fills, or calculate a result. ICT’s interpretation should therefore be treated as an example of his own market framework, not as proof of a predictive or profitable edge. This summary is educational commentary and not investment advice.
Watch the original ICT lesson
This article draws on the timestamped automatic transcription of ICT Pattern Recognition Drill – OTE UsdJpy New York Session 10/27/17. The transcript preserves the speaker’s words; it is not independent proof of the reported chart behavior or any trading outcome. The recording’s visual detail remains important when following the annotations.
Watch the original lesson on YouTube
The video cannot be played inside another website: when its embedded player was opened and clicked on 22 September 2026, the player itself reported “Playback on other websites has been disabled by the video owner.” That is why no embed is reserved or left blank here; the recording itself is available directly on YouTube.
Watch ICT Pattern Recognition Drill – OTE UsdJpy New York Session 10/27/17 on YouTube ↗
Primary source and further reading
- The original Inner Circle Trader lesson: use the timestamp links in this article to compare the explanation with its source.
- YouTube’s embedding documentation: platform guidance relevant to the external watch link above.
- 17 CFR 4.41: disclosures concerning hypothetical performance: a regulatory reference, not a statement that a particular recording or this article meets every legal requirement.
This is independent educational commentary. It is not official ICT material, a tested trading system, or a claim that the reported results can be reproduced.





