
Key takeaways
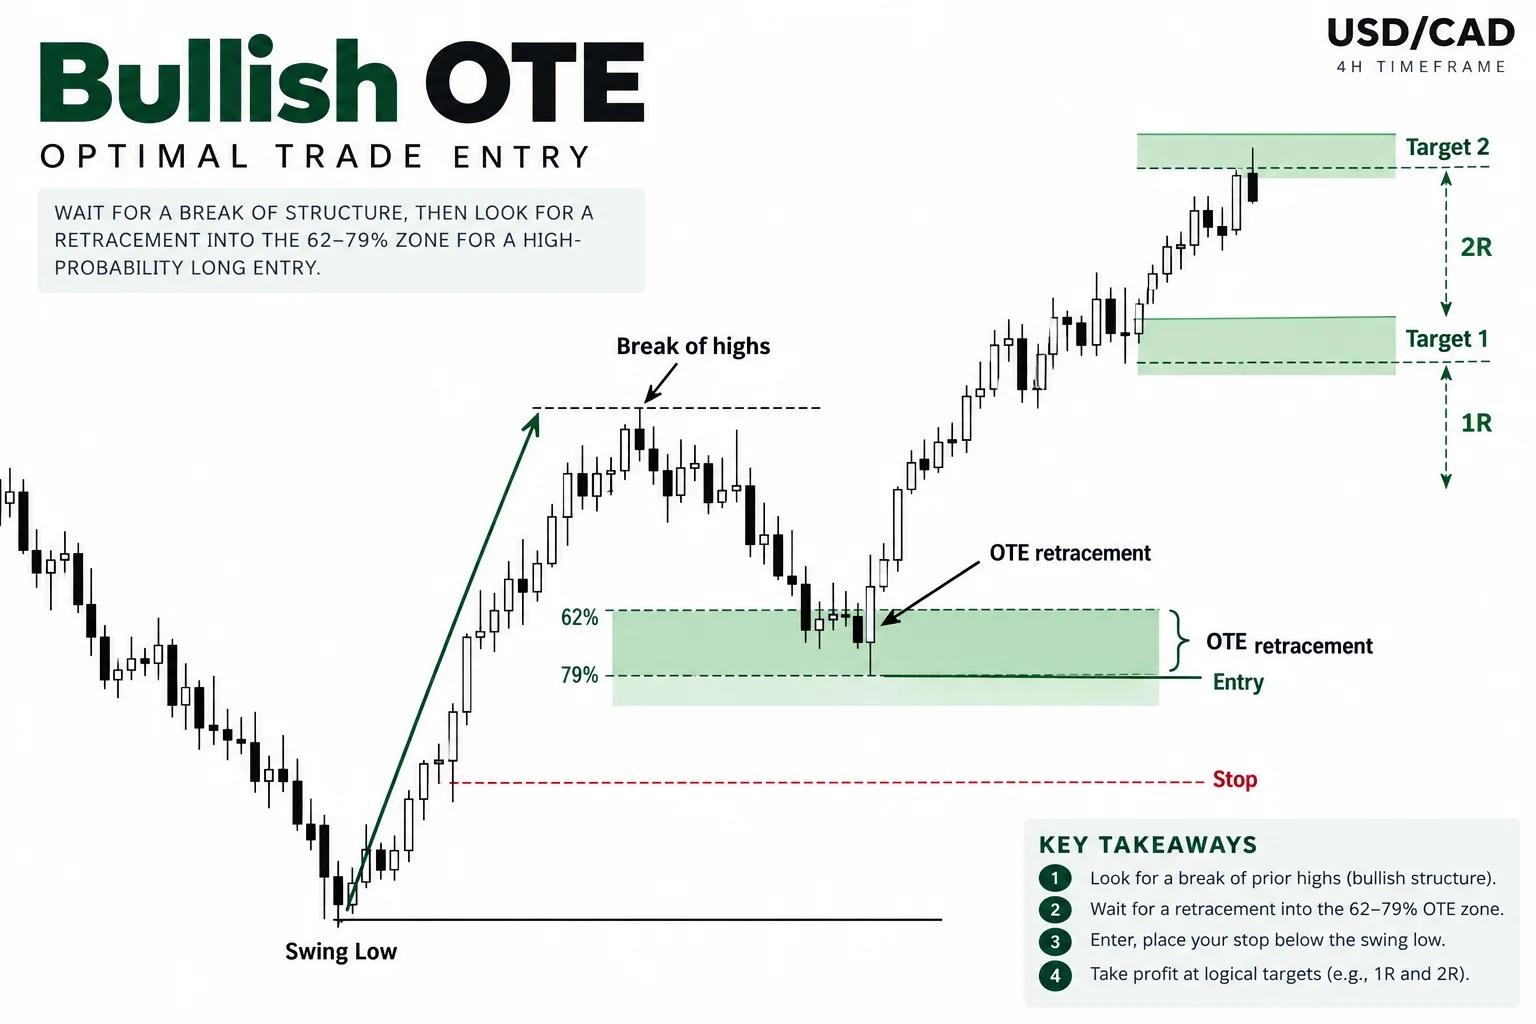
ICT’s USD/CAD pattern-recognition drill presents a bullish optimal trade entry from the October 27, 2017 New York session, showing price move above prior highs, retrace into a measured OTE region, and advance toward staged profit objectives.
Read the full summary
ICT’s USD/CAD pattern-recognition drill presents a bullish optimal trade entry from the October 27, 2017 New York session, showing price move above prior highs, retrace into a measured OTE region, and advance toward staged profit objectives. At 14 seconds ICT asks viewers to identify the pattern, around 28 seconds he highlights expansion through nearby highs, at 53 seconds he identifies the return into OTE, around 1 minute 2 seconds he discusses scaling out at a first objective and targeting an ICT symmetrical price swing with claimed pip-level precision, and at 1 minute 9 seconds he anchors a Fibonacci tool from the low to the high for a projection that aligns with the target. Near 1 minute 41 seconds he calls it a clear OTE example during the New York Killzone, but the automatic transcript does not provide exact prices, Fibonacci percentages, candle details, session times, fills, costs, or evidence of repeatable performance.
How we researched this article
BestProps used document-based research from primary firm sources, checked September 25, 2026. The complete source list, scope, limitations, and commercial-state record appear near the end of this article.
In this brief pattern-recognition drill, ICT presents what he describes as an optimal trade entry, or OTE, on a USD/CAD chart. The video title associates the example with the New York session on October 27, 2017, while the video itself was uploaded on October 29, 2017. Because the available source is an automatically transcribed audio track, the chart’s exact prices and candle details cannot be independently read from the transcript.
Watch the primary video on YouTube.
What ICT Identifies in the OTE Pattern
At 0:14, ICT opens with a pattern-recognition prompt: “What do you see?” He then labels the chart formation an OTE “at the point of inception.” This frames the clip as a compact visual exercise rather than a complete lesson on how the concept is constructed or validated.
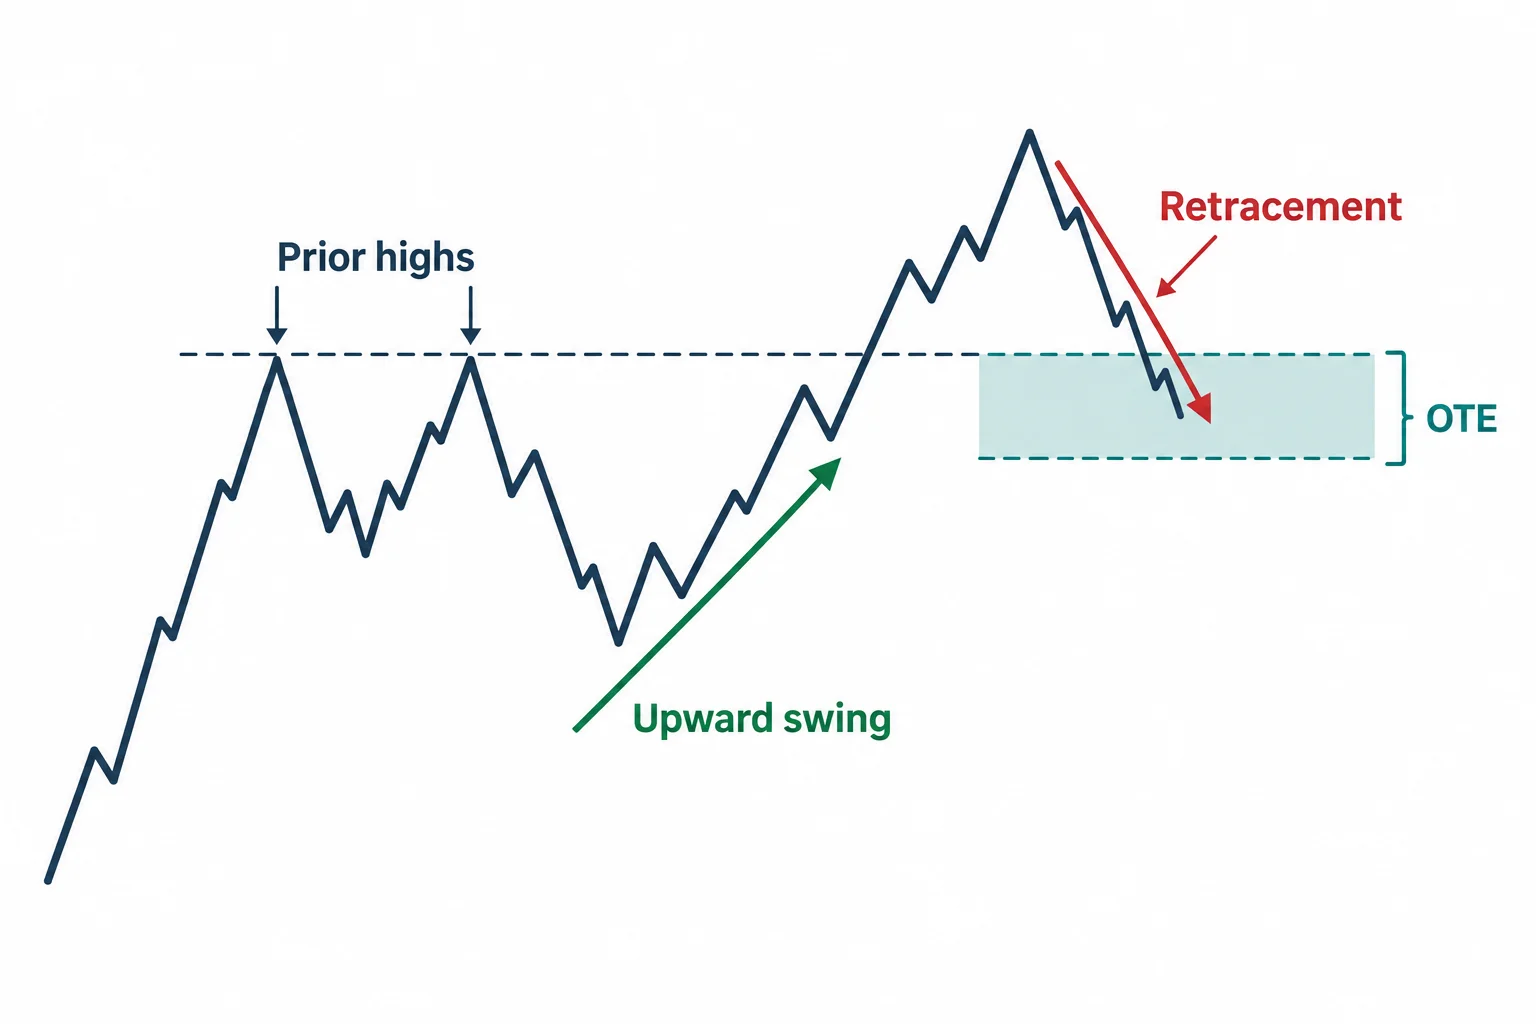
Beginning around 0:28, ICT describes price moving above prior highs and interprets that movement as evidence of willingness to continue higher. One phrase in this section is unclear in the automatic transcript, but the surrounding discussion supports the broader point: he is drawing attention to an upward move through nearby highs before a retracement.
ICT next says to measure from a low toward the upper candle area. At 0:53, he states that price returns into the OTE region. Although a Fibonacci tool is mentioned later, the transcript does not provide exact retracement percentages, chart prices, or enough visual information to reconstruct his anchors with certainty.
ICT OTE Drill Targets and Symmetrical Price Swings
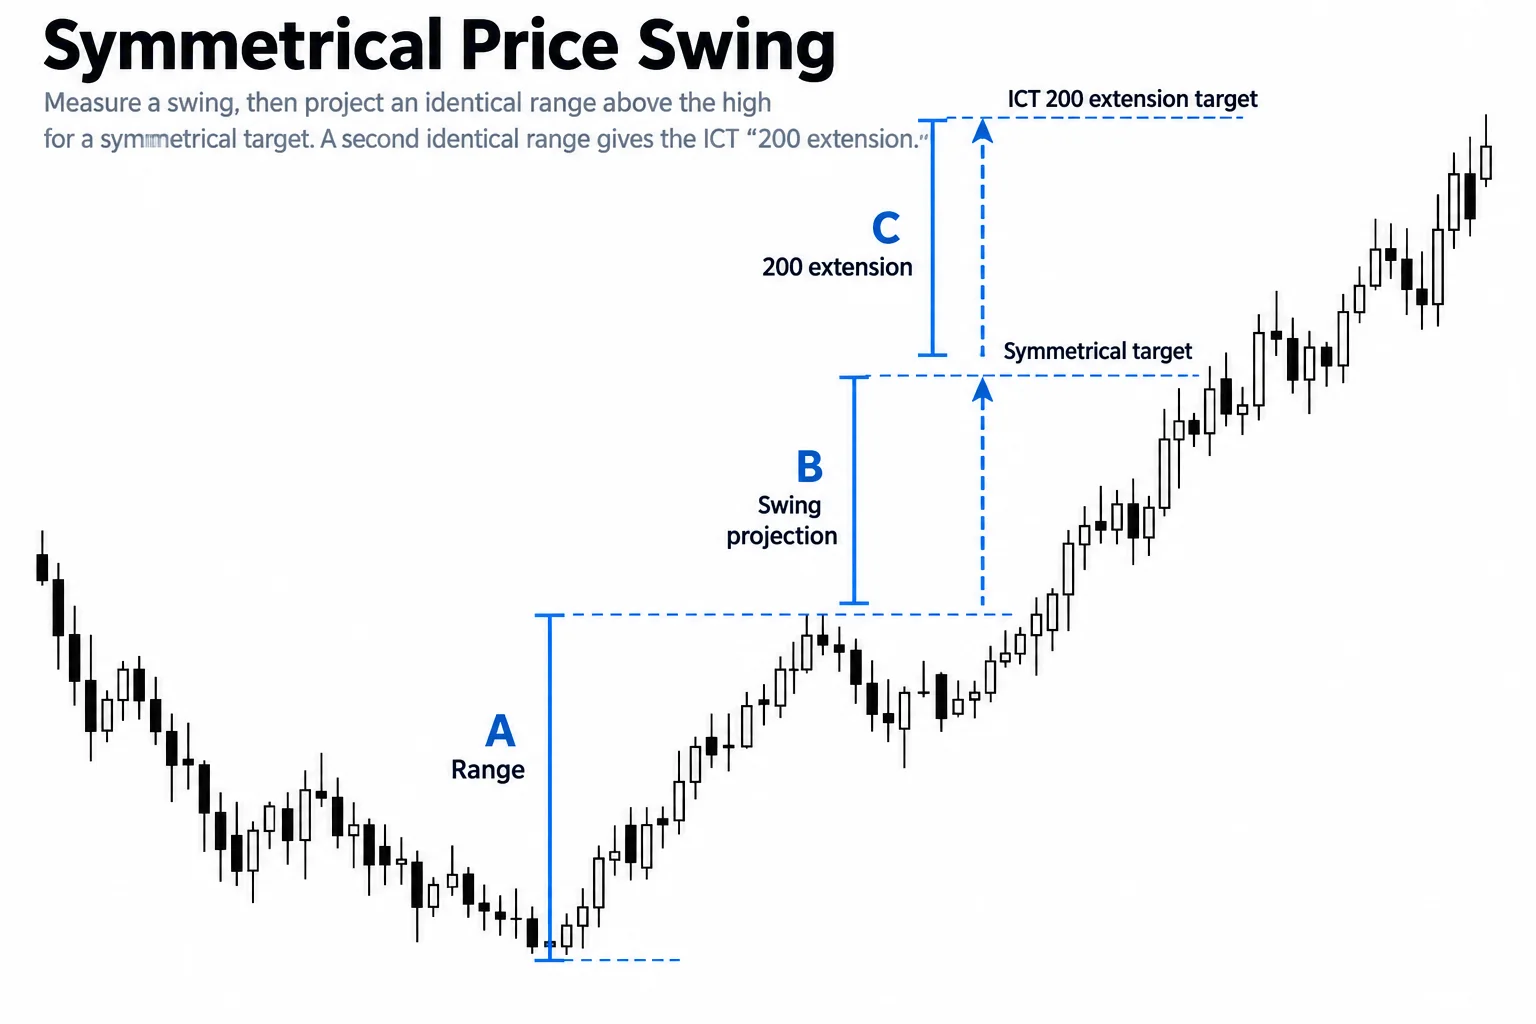
At approximately 1:02, ICT discusses scaling out at a first profit objective and then references a second target. He characterizes the latter as an “ICT symmetrical price swing” reached with pip-level precision. That is ICT’s interpretation of the displayed example; the transcript alone does not establish actual fills, execution costs, or a repeatable trading advantage.
He also explains at 1:09 that a Fibonacci tool can be anchored from the identified low to the high. According to ICT, this produces another projection aligning with the target. The clip therefore combines two ideas:
- A bullish retracement into the area ICT calls optimal trade entry.
- A projected objective based on what he calls a symmetrical price swing.
How to Study the ICT OTE Drill
The most useful way to study this short clip is as a chart-labeling exercise. A viewer can pause at the opening question, identify the relevant high and low, note the move above the highs, and then compare that reading with ICT’s explanation. The sequence being taught is directional expansion, retracement into a measured area, and projection toward staged objectives.
Near 1:41, ICT calls it a clear example of OTE precision during the New York “Killzone,” his terminology for a particular session window. The transcript does not state the window’s clock times, so they should not be inferred from this clip alone.
Resources
- ICT Pattern Recognition Drill – OTE USD/CAD New York Session 10/27/17 (YouTube) — the primary source clip this article describes; use the timestamp links above to compare each explanation against the recording.
- OTE in Trading: The ICT Optimal Trade Entry Explained (theinnercircletraders.com) — unofficial, untested third-party companion article describing the 62–79% OTE zone and its six Fibonacci levels.
- ICT Trading Books and PDF Guide (theinnercircletraders.com) — unofficial, untested third-party guide to the free ICT curriculum and how it is derived from Michael Huddleston’s YouTube channel.





