
Key takeaways
The Inner Circle Trader on YouTube presents a 5 minutes 31 seconds retrospective gold pattern recognition drill using ICT’s Optimal Trade Entry framework for the October 27, 2017 New York session, uploaded October 29, 2017.
Read the full summary
The Inner Circle Trader on YouTube presents a 5 minutes 31 seconds retrospective gold pattern recognition drill using ICT’s Optimal Trade Entry framework for the October 27, 2017 New York session, uploaded October 29, 2017. The workflow combines higher time frame bullish context, a stop run below equal lows, a bullish breaker, market structure, displacement, an unfulfilled price range, deliberate swing selection, and Fibonacci retracement and extension measurements. At 2 minutes 24 seconds, ICT treats a 62% retracement touch as sufficient for a hypothetical long, then maps an extension objective near 1273.7 with staged profit taking. When that objective is not immediately reached, he redraws the range from the swing low to the highest candle body rather than the wick, producing a revised symmetrical target near 1273.8 and a narrated rally toward 1274.0. Another OTE appears near what the transcript calls the 79 subtraction level at 4 minutes 43 seconds, but this is likely a transcription error requiring confirmation from the chart and audio. Fibonacci is used as a measurement tool rather than the claimed cause of price movement, and the lesson provides no brokerage records, independently verifiable execution, or proof that market makers or algorithms caused the move.
How we researched this article
BestProps used document-based research from primary firm sources, checked September 25, 2026. The complete source list, scope, limitations, and commercial-state record appear near the end of this article.
This lesson reviews a gold chart through ICT’s Optimal Trade Entry (OTE) framework. The video title identifies the example with the New York session dated October 27, 2017, while the video itself was uploaded on October 29, 2017. It is a retrospective pattern-recognition exercise rather than a complete, independently verifiable trade record.
Watch the full primary video: “ICT Pattern Recognition Drill – OTE Gold New York Session 10/27/17.”
How ICT Defines OTE Pattern Recognition
At 0:22, ICT characterizes an OTE as a retracement followed by explosive movement, volatility, magnitude and impulsive price action. He treats those features as evidence for his interpretation of institutional or “smart money” participation. That attribution is part of ICT’s market model; the transcript does not independently establish who caused the move.
He also stresses that the Fibonacci tool is not presented as the cause of a market reaction. In his explanation, it simply marks levels within a price swing so the analyst can organize the setup. This distinction is useful: a drawing tool measures a selected range, while the trading thesis depends on how that range, market structure and surrounding liquidity are interpreted.
ICT OTE Gold Breaker and Stop Run
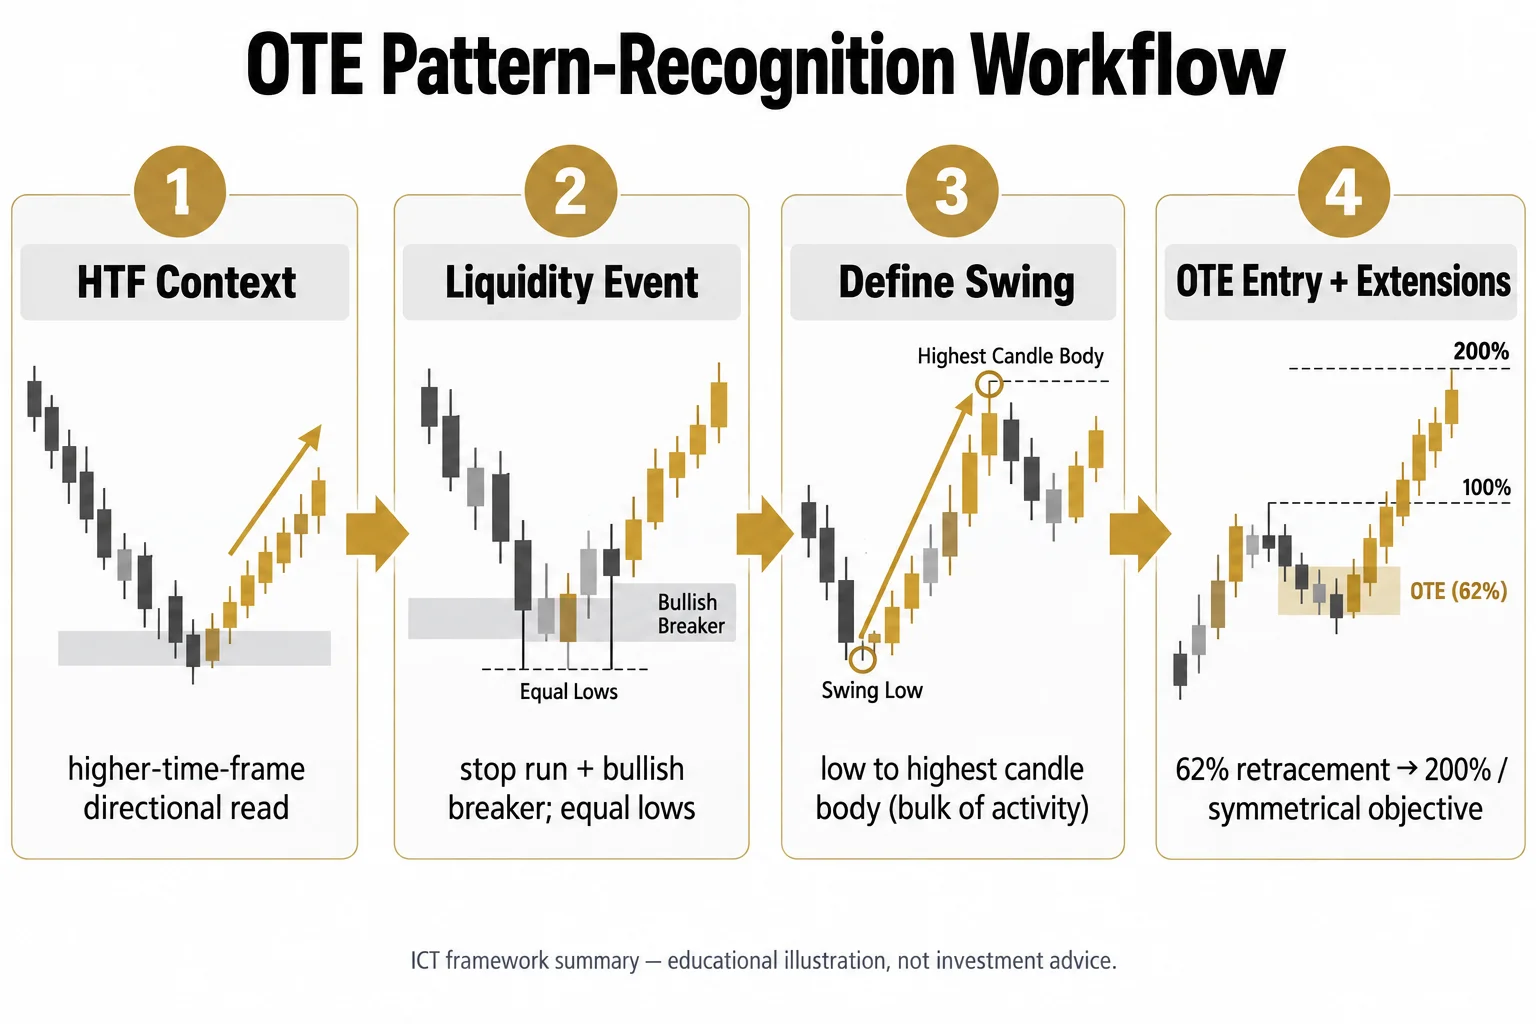
The gold example begins around 1:17. ICT identifies what he calls a stop run and a bullish breaker. He says the same area can therefore be read in two ways: as an OTE long and as a bullish-breaker setup supported by a higher-time-frame view.
At 2:24, he discusses price reaching a 62% retracement level. He describes that touch as sufficient for the hypothetical long entry in this example, although he acknowledges that an actual fill could occur elsewhere. The recording does not provide brokerage records, order details or enough visual information to verify an execution.
ICT then points to equal lows below the market. His interpretation is that traders may view those lows as double- or triple-bottom support, after which price can move below them to trigger resting stops. He argues that the rally away from this area contributes to the bullish-breaker thesis. Terms such as “market makers” and “algorithm” are used in the narration as elements of ICT’s framework, not as independently demonstrated causes.
ICT OTE Gold Targets and Second Measurement
ICT identifies an extension objective stated as approximately 1273.7 at 2:40. He also describes staged profit-taking at nearer objectives. The initial swing shown in the lesson does not immediately reach the larger objective, so he redraws the Fibonacci measurement using another price swing.
The important construction detail appears from 3:55. For this exercise, ICT measures from the low to the highest candle body in the swing rather than automatically using the wick. He says the body is intended to represent the bulk of the activity being measured. He notes that wicks may be included in some target projections, but keeps this drill focused on his stated body-based rules.
The revised symmetrical swing is described at approximately 1273.8. ICT then identifies another OTE near what the transcript renders as the “79 subtraction level” at 4:43. This phrase is likely an automatic-transcription error, possibly referring to a retracement level, so it should be checked against the chart and original audio. In the narrated chart review, price subsequently rallies into an area he rounds to 1274.0.
How the ICT OTE Gold Pattern Fits Together
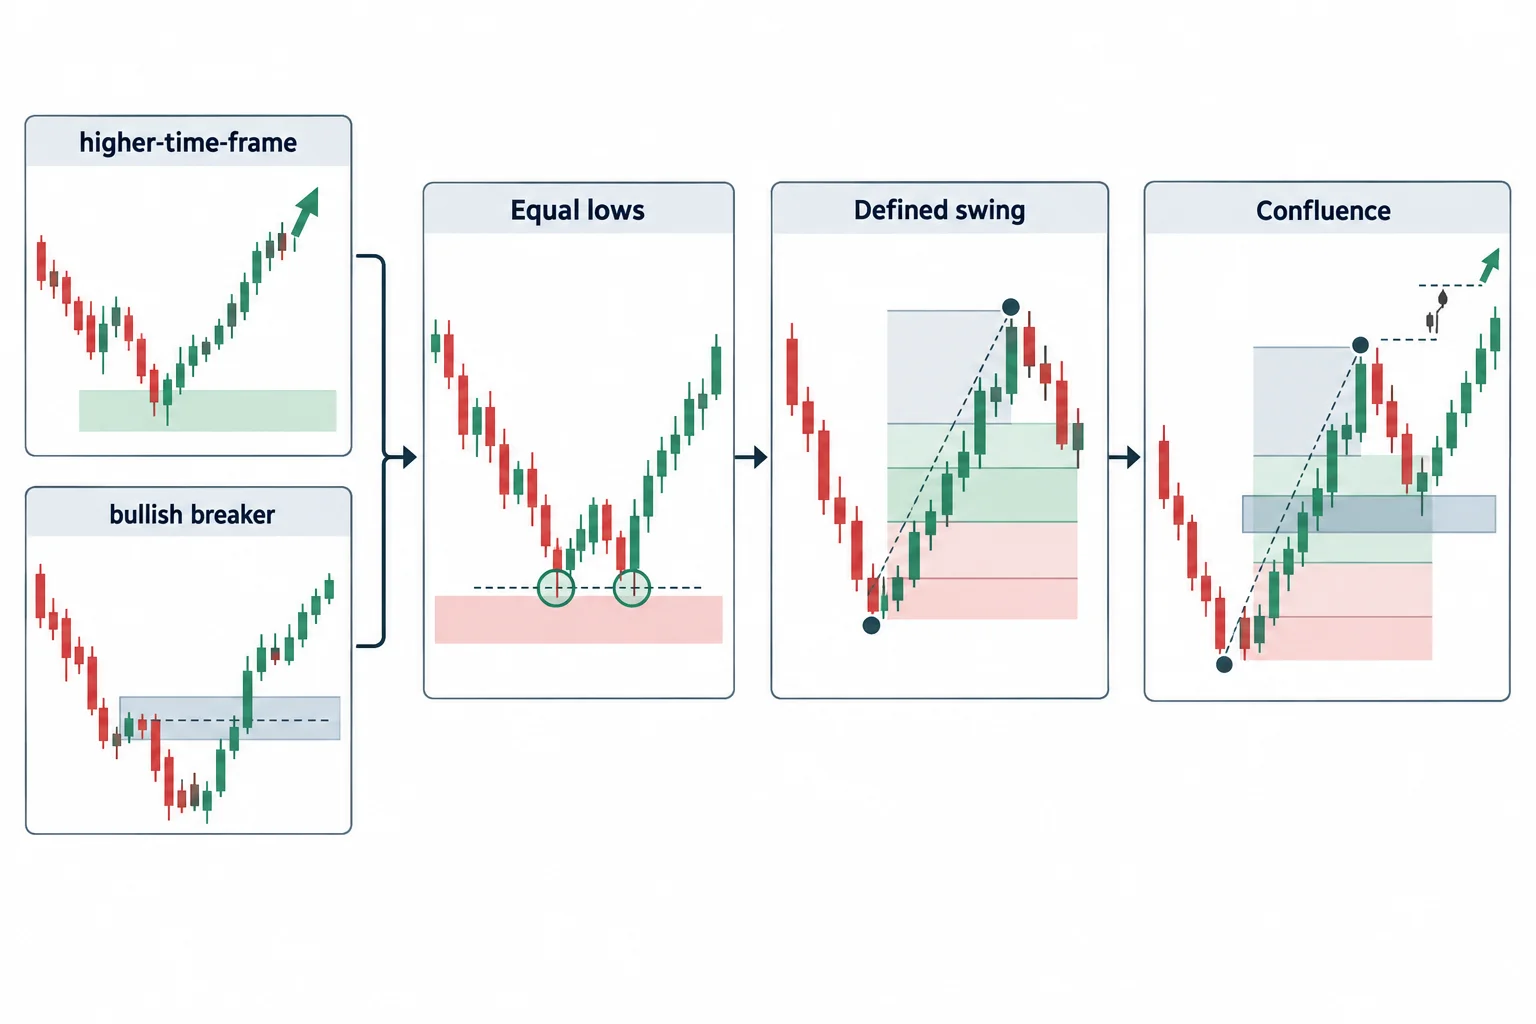
Near 5:07, ICT adds two contextual reasons for selecting the later swing: what he calls an unfulfilled price range and a break in market structure marked by a slightly higher high. These features serve as an alert to look for another OTE retracement rather than treating every Fibonacci level as a standalone signal.
- Context first: ICT starts with a higher-time-frame directional interpretation and a bullish breaker.
- Liquidity narrative: Equal lows are treated as a possible pool of stops rather than guaranteed support.
- Defined swing: The Fibonacci range depends on deliberately selected endpoints.
- Confluence: The retracement is considered alongside structure, displacement and an unfulfilled range.
- Reassessment: When the first projected objective is not immediately reached, ICT measures a subsequent swing instead of claiming the initial projection was instantly fulfilled.
ICT OTE Pattern Recognition Takeaways
The main lesson is a pattern-recognition workflow: establish directional context, identify a liquidity event and structural shift, define the relevant swing, and then use retracement and extension levels to map a scenario. It should not be read as proof that these labels predict future price action. Because the transcript cannot reveal unseen chart details, exact fills or later outcomes, readers should use the original video to inspect the drawings associated with each timestamp.
More ICT OTE Gold Resources
- ICT Pattern Recognition Drill – OTE Gold New York Session 10/27/17 the primary source lesson summarized in this article.
- ICT OTE Primer – Intro To Optimal Trade Entry ICT’s own foundational walkthrough of the OTE model referenced throughout this drill.
- The Inner Circle Trader on YouTube ICT’s channel, with the full library of original lectures and pattern-recognition drills.
This commentary is educational and does not provide investment advice or promise trading performance.




