
Key takeaways
ICT’s AUD/USD New York session drill for October 27, 2017 teaches recognition of a bullish Optimal Trade Entry setup rather than documenting a verified trade result.
Read the full summary
ICT’s AUD/USD New York session drill for October 27, 2017 teaches recognition of a bullish Optimal Trade Entry setup rather than documenting a verified trade result. At 16 seconds ICT identifies an OTE long at inception, with price breaking above a short-term high to signal bullish market structure before retracing into the marked OTE area. Around 1 minute 20 seconds he places a hypothetical stop at the referenced structural low and discusses approximate 2-to-1 and 3-to-1 reward-to-risk objectives. At 1 minute 45 seconds he projects the low-to-high range twice above the high to create a symmetrical 200 extension, although transcript values of .79 and .7679 are inconsistent and require video verification. At 2 minutes 19 seconds he revisits an earlier bullish breaker, describes buying its retest and applies a Fibonacci-based projection, then by 2 minutes 53 seconds presents overlap among OTE, breaker and range targets as confluence. The transcript provides no confirmed order, fill, spread, slippage, exact entry or stop prices, realized return or evidence of a repeatable edge. An unofficial companion at theinnercircletraders.com describes the OTE zone as a 62–79% retracement with six Fibonacci levels, but it is untested third-party material.
How we researched this article
BestProps used document-based research from primary firm sources, checked September 25, 2026. The complete source list, scope, limitations, and commercial-state record appear near the end of this article.
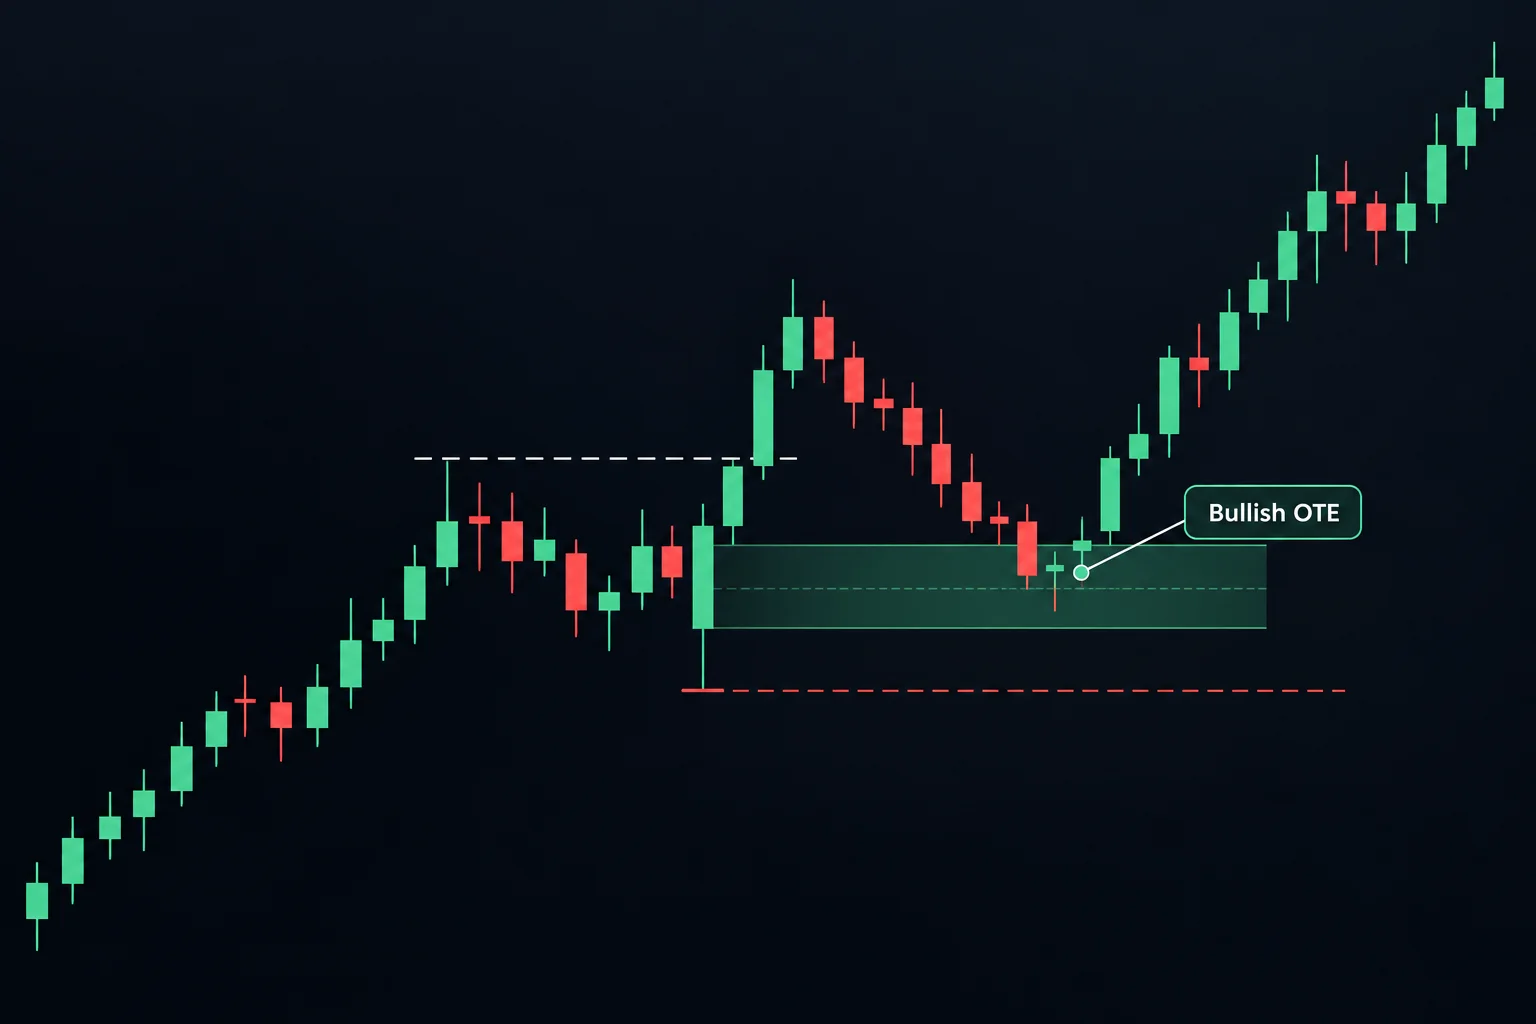
In this short pattern-recognition drill, ICT reviews what he identifies as a bullish Optimal Trade Entry (OTE) setup on AUD/USD. The video title associates the example with the New York session on October 27, 2017, while the video itself was uploaded on October 29, 2017. The lesson concentrates on recognizing the setup from market structure, a retracement and projected price extensions rather than documenting an independently verifiable trade result.
Watch the primary video on YouTube.
Bullish ICT OTE Pattern Setup
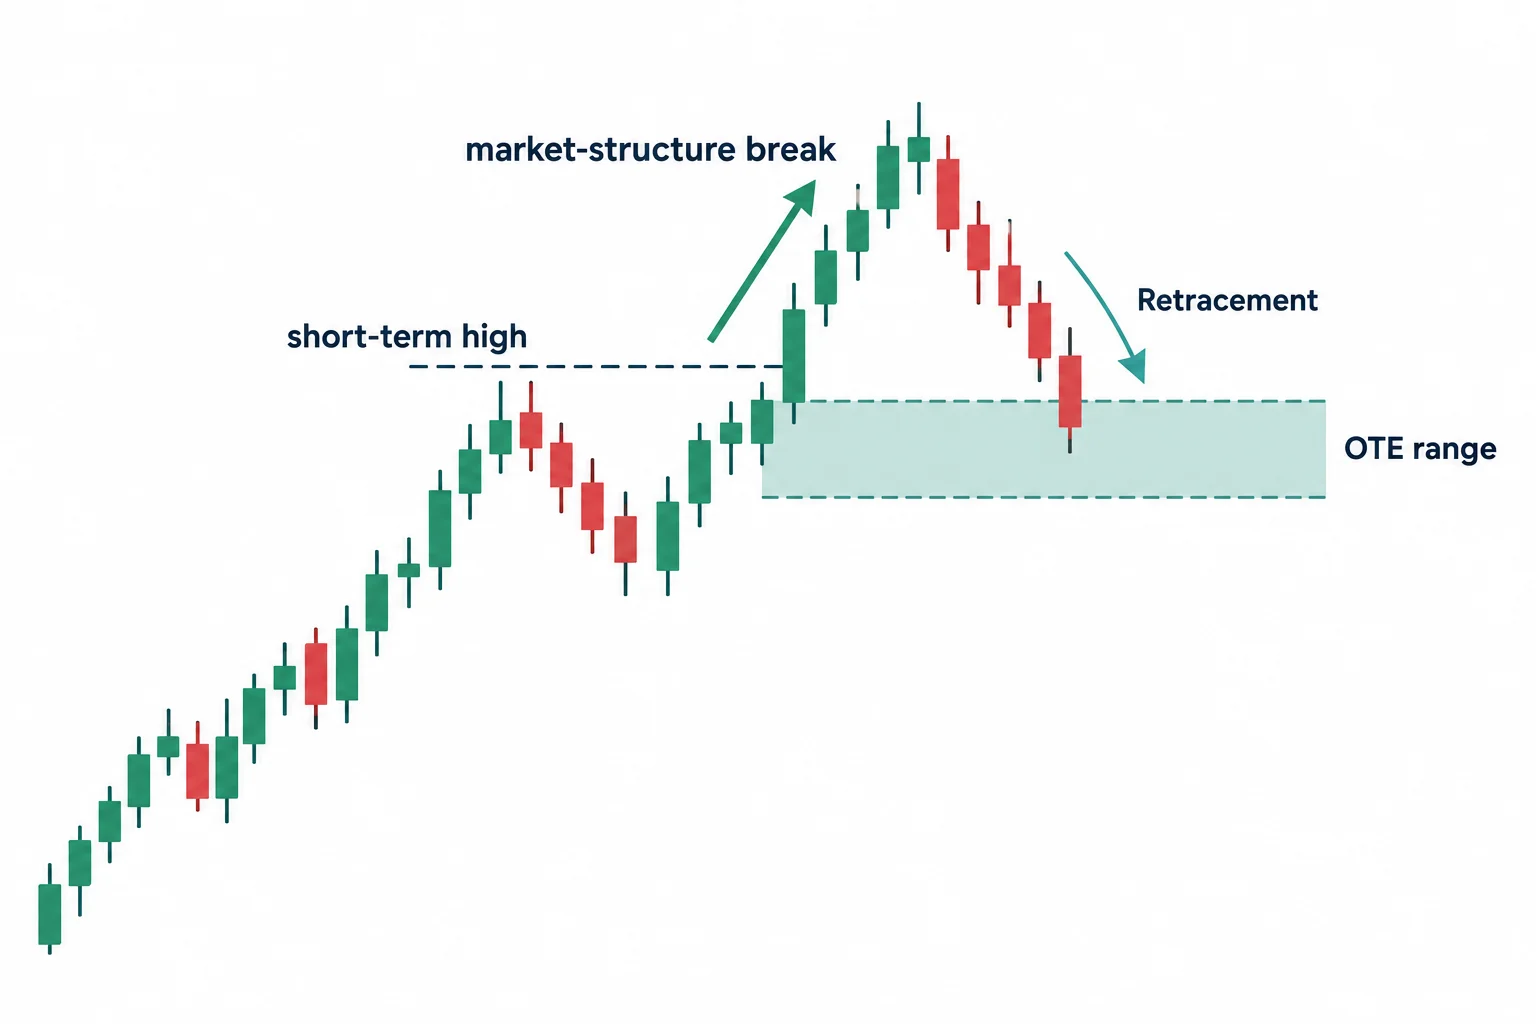
At 0:16, ICT asks viewers what they see and then labels the chart as an OTE long setup “at the point of inception.” This makes the clip a recognition exercise: viewers are being asked to identify a developing pattern from the chart rather than merely inspect the move after completion.
ICT temporarily sets aside an earlier stop run and what he calls a bullish breaker. His main sequence is:
- Price moves above a short-term high.
- ICT interprets that move as a market-structure break.
- The break alerts him to watch for a possible bullish OTE.
- Price then retraces into the area he has marked as the OTE range.
The structure discussion begins around 1:00. ICT says the trade above the short-term high is the event that puts an OTE long on his radar. In his framework, the initial displacement or break supplies directional context, while the subsequent pullback supplies the prospective entry area.
ICT OTE Risk and Reward
At approximately 1:20, ICT discusses the retracement into the OTE region. He notes that price wicks slightly through the marked area and places the hypothetical stop at the referenced low. He then describes possible reward-to-risk objectives of roughly two-to-one or three-to-one, with a more ambitious objective based on a price extension.
This is ICT’s interpretation of the displayed example, not proof that the pattern provides a repeatable edge. The transcript does not establish an actual order, fill, spread, slippage or realized return. It also does not provide enough visual data to reconstruct exact entry and stop levels from the audio alone.
ICT Pattern Extension Target
ICT turns to range projection at 1:45. He defines a range from a low to a high and explains that duplicating this range above the high creates a symmetrical price-swing projection. Applying two such range extensions produces what he calls a 200 extension.
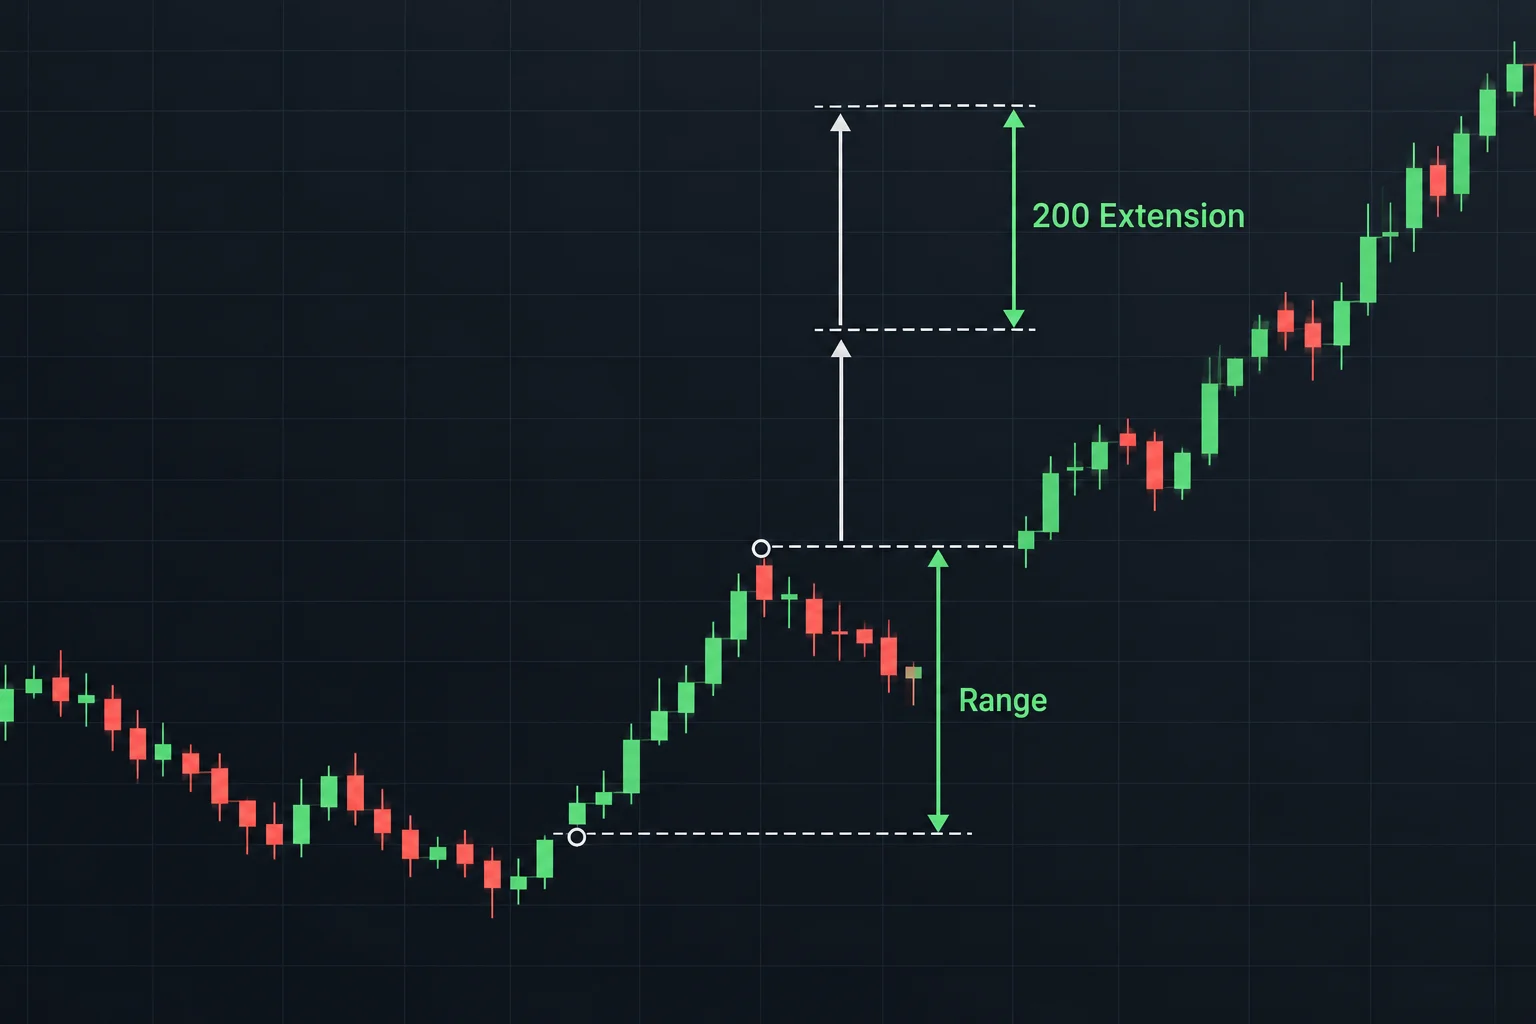
He then compares the projection with the day’s displayed high. The automated transcript renders the projected value as “.79” and the later chart reading as “.7679.” Given that inconsistency and the lack of visual chart verification, the precise decimal formatting should be checked directly against the video rather than inferred from the transcript.
Bullish ICT OTE Breaker
After completing the principal OTE explanation, ICT returns to the concept he initially excluded. At 2:19, he revisits the earlier area and identifies it as an ICT bullish breaker. He describes buying a retest of that breaker and applying a Fibonacci-based projection from the associated range.
By 2:53, he uses the low and high around the breaker retest to derive another target. ICT presents the overlap between the OTE, breaker and range projections as confluence among repeating price phenomena.
ICT Pattern Recognition Takeaways
The most useful lesson is the order of analysis rather than any isolated Fibonacci number:
- Identify the short-term high relevant to the proposed directional change.
- Wait for the market to trade above it before considering the bullish structure confirmed under ICT’s terminology.
- Observe whether price retraces into the selected OTE area.
- Define invalidation with reference to the structural low.
- Compare nearer reward-to-risk objectives with range-based extension targets.
- Treat a breaker retest as separate supporting context rather than confusing it with the core OTE sequence.
This interpretation is educational and specific to ICT’s explanation in the cited recording. The short transcript does not test the method across different instruments or market conditions, and it should not be read as investment advice or a performance promise.
ICT AUDUSD Drill Resources
- ICT Pattern Recognition Drill – OTE AudUsd New York Session 10/27/17 (YouTube) The primary source clip this article describes; use the timestamp links above to compare each explanation against the recording.
- OTE in Trading: The ICT Optimal Trade Entry Explained (theinnercircletraders.com) Unofficial, untested third-party companion article describing the 62–79% OTE zone and its six Fibonacci levels.
- ICT Trading Books and PDF Guide (theinnercircletraders.com) Unofficial, untested third-party guide to the free ICT curriculum and how it is derived from Michael Huddleston’s YouTube channel.




