
Key takeaways
ICT Forex Price Action Lesson on Orderflow and Volume Imbalances presents an unverified top-down methodology using the U.S.
Read the full summary
ICT Forex Price Action Lesson on Orderflow and Volume Imbalances presents an unverified top-down methodology using the U.S. Dollar Index around August 31 and September 1, 2020 across daily, 15-minute and five-minute charts. ICT defines a sell-side volume imbalance as a body-to-body interval between adjacent candles whose wicks may overlap, then anticipates a revisit while price remains below it. He distinguishes this from a three-candle fair value gap with incomplete overlap and from liquidity pools suspected above highs or below lows. The process begins with a bearish higher-time-frame destination, uses a quarterly shift said to occur every three to four months, maps equal highs and lows, bearish order blocks and mitigation blocks, and culminates in a five-minute market maker sell model targeting an older daily fair value gap. His bearish rule of thumb is to study the range from the midpoint to the low of a large down-close daily candle during the next session. ICT uses candle bodies as a proxy because decentralized spot forex lacks a single comprehensive volume measure, states that the lesson is not a signal service or complete entry, stop and target system, and provides no empirical validation, verified fills or proof of profitability. A neutral review should predefine and record body gaps, fair value gaps, revisit times, reactions and failures rather than assume every imbalance is tradable.
How we researched this article
BestProps used document-based research from primary firm sources, checked September 25, 2026. The complete source list, scope, limitations, and commercial-state record appear near the end of this article.
In ICT Forex Price Action Lesson: Orderflow & Volume Imbalances, ICT presents his interpretation of how candle-body gaps, liquidity pools and higher-time-frame context can be used to study price delivery. The lesson uses the U.S. Dollar Index around August 31 and September 1, 2020, moving from a daily chart to 15-minute and five-minute charts.
The presentation contains strong claims about algorithmic control and forecasting precision. Those are ICT’s market interpretations, not facts established by the transcript. Because the source is an audio transcript without chart images, the visible levels and candle relationships cannot be independently checked here.
ICT Price Action Context Before a Setup
ICT begins by contrasting his framework with conventional support and resistance, trend following and indicator-based analysis. At 11:58, he introduces what he calls a “quarterly shift”: a significant directional swing that he says tends to appear every three to four months. He treats this larger move as the context from which a trader would form a directional bias.
This is important because the lesson does not present a volume imbalance as an isolated entry signal. ICT repeatedly argues that a price feature only becomes useful when it sits inside a broader narrative about where price may be drawn. In this example, he describes a bearish Dollar Index outlook and then uses lower-time-frame structures to illustrate that thesis.
He also explicitly says the material is not a signal service and does not supply a complete buy, stop and target recipe. That qualification appears during his discussion of bias and variable market conditions at 12:52.
ICT Volume Imbalance Explained
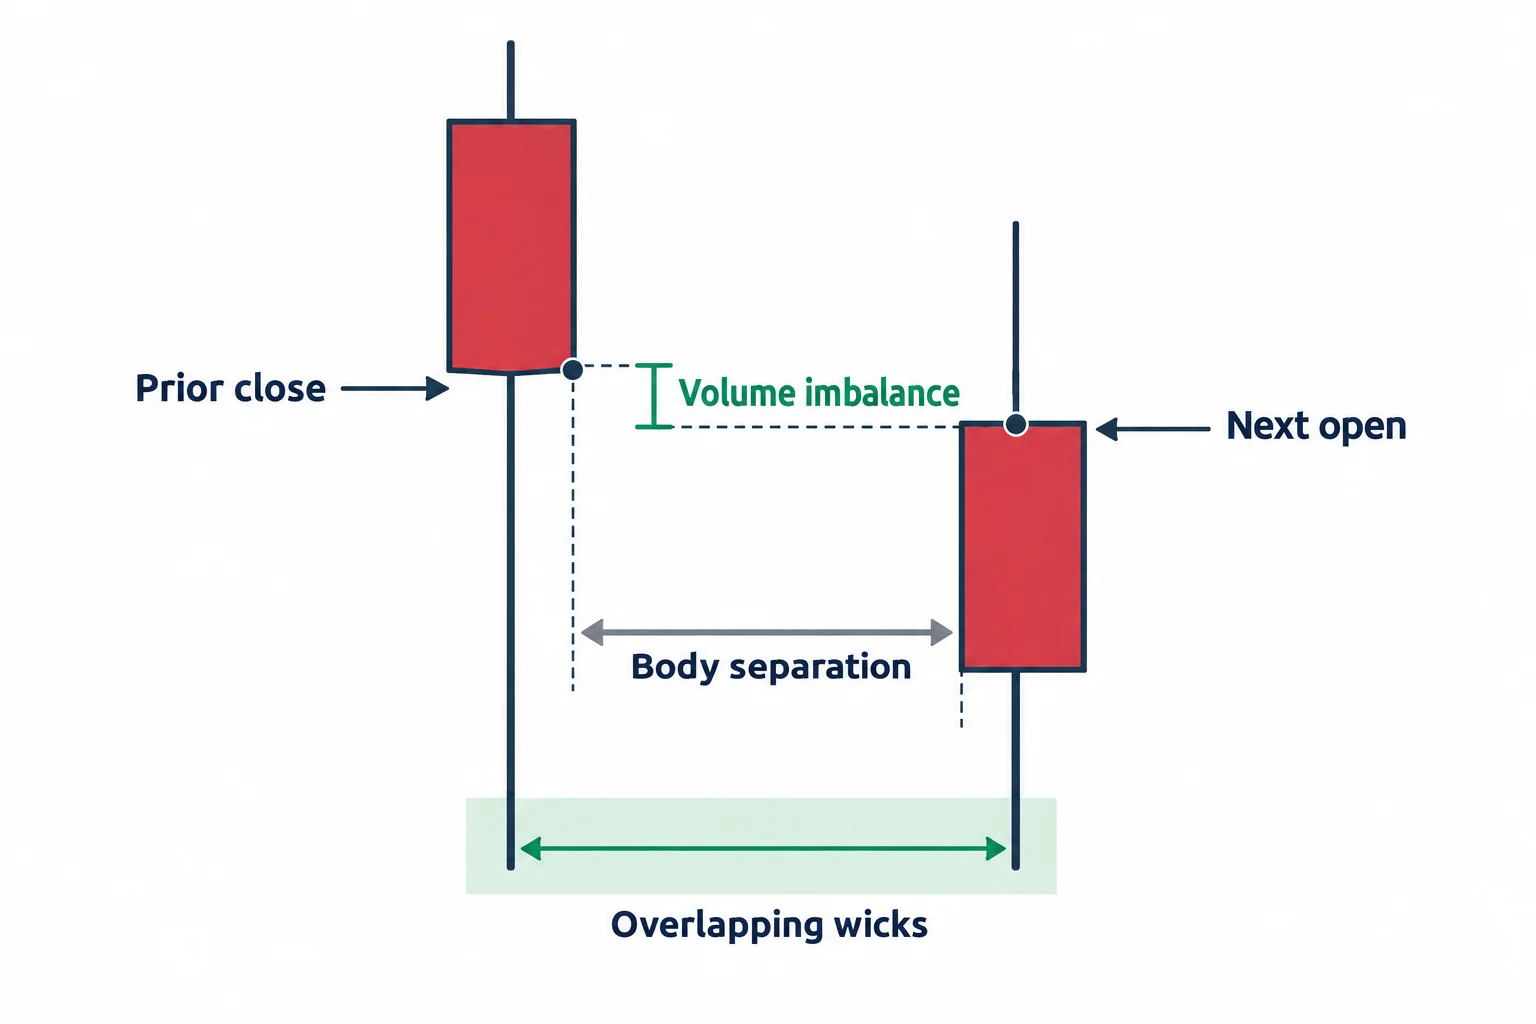
The main definition begins at 24:32. ICT points to two adjacent candles and identifies a small difference between the first candle’s close and the next candle’s open. Their wicks may overlap, so this is not a conventional chart gap with an entirely untraded interval. Instead, the separation exists specifically between the candle bodies.
In ICT’s terminology, a bearish or sell-side volume imbalance has these characteristics:
- Two neighboring candle bodies do not meet at the prior close and subsequent open.
- The candles’ wicks or tails may still overlap.
- Price is below the body-level interval after it forms.
- ICT then watches for price to revisit that interval before potentially continuing lower.
At 26:57, he says the working expectation is a return into the imbalance. His explanation is that price moved down too quickly and left a body-based discontinuity. This is a conceptual reading of candles; the transcript does not provide volume data or an empirical test demonstrating that such revisits occur reliably.
ICT also notes that decentralized spot forex does not provide the single, comprehensive volume measure one might expect from a centralized venue. He therefore uses candle bodies as a proxy within this framework rather than treating a volume profile as a complete representation of forex activity.
ICT Volume Imbalance vs Fair Value Gaps
The lesson treats a volume imbalance and a fair value gap as different structures. The volume imbalance concerns the close and open of two adjacent candle bodies. By contrast, ICT’s fair value gap is described through a three-candle displacement in which part of the move is not overlapped by the surrounding candles.
Beginning at 34:06, ICT identifies a daily fair value gap near relatively equal lows. He interprets those lows as a pool of sell-side liquidity because protective sell stops may rest beneath them. In his narrative, price can move through those lows and into the gap, allowing short positions to be covered through buying.
A useful distinction from the lesson is therefore:
- Volume imbalance: a body-to-body difference between adjacent candles, despite possible wick overlap.
- Fair value gap: an interval associated with rapid three-candle displacement and incomplete overlap.
- Liquidity pool: a suspected concentration of orders above highs or below lows.
These are definitions within ICT’s methodology. They should not be interpreted as proof that actual institutional orders occupy a particular chart level.
ICT Price Action From Daily to Five Minute Charts
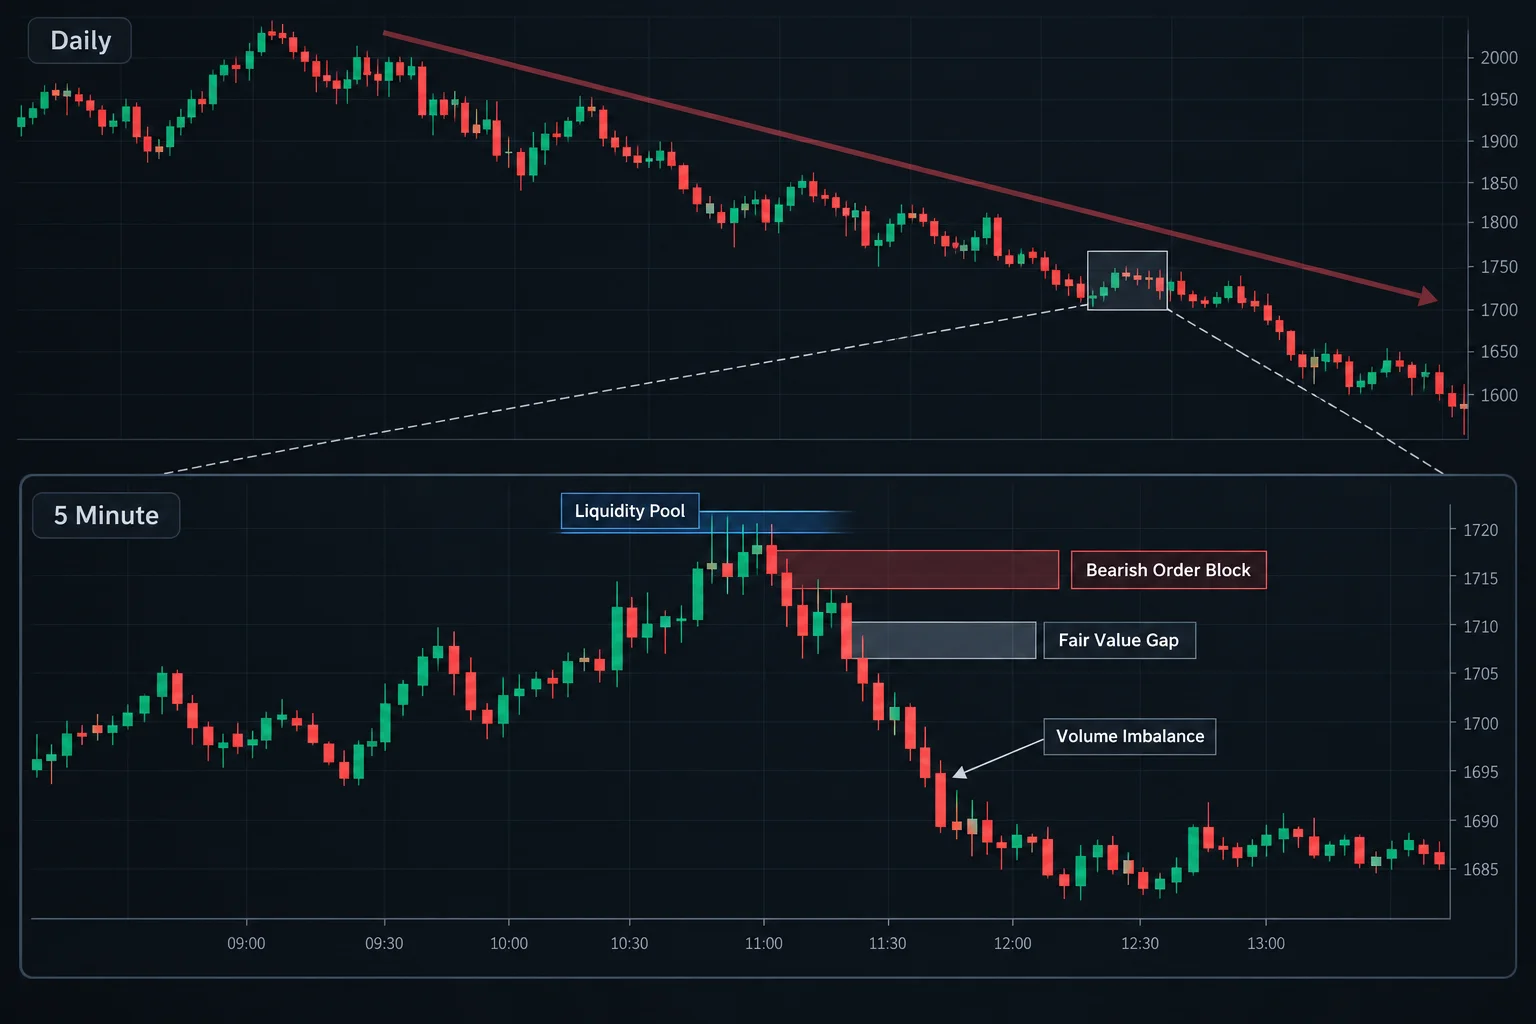
ICT next connects the daily narrative to lower-time-frame analysis. At 1:00:33, he offers a rule of thumb for a bearish market: after a large down-close daily candle, focus on the interval from that candle’s midpoint to its low when studying possible continuation setups during the next session.
He then moves to a 15-minute chart at 1:03:28. He describes price moving above relative equal highs (an area he labels buy-side liquidity) and returning to the opening level of a prior up-close candle, which he calls a bearish order block. The transcript reports chart values, but without the chart those values and exact touches cannot be verified.
On the five-minute view at 1:11:53, he combines several elements:
- a higher-time-frame bearish bias;
- liquidity above short-term highs;
- overlap between a bearish order block and what he calls a mitigation block;
- a retracement into his preferred entry region; and
- the older daily fair value gap as the larger downside objective.
ICT labels the complete intraday sequence a “market maker sell model.” The educational takeaway is not simply to mark every candle-body gap. His stated process starts with a higher-time-frame destination, identifies possible liquidity around prior highs or lows, and only then examines lower-time-frame retracements.
How to Study ICT Orderflow and Volume Imbalances
A neutral way to study the lesson is to annotate historical charts without assuming the conclusion. Mark adjacent body gaps, three-candle fair value gaps and relative highs or lows. Record whether price revisits each area, how long that takes, and how often price crosses it without reacting. Define every rule before reviewing results so that labels are not changed after the move.
The transcript itself acknowledges periods of uncertainty and cases in which ICT says he would remain inactive. That is a more useful constraint than treating every imbalance as a trade. The video provides a detailed example of ICT’s vocabulary and top-down reasoning, but it does not establish profitability, show verified fills or supply enough evidence to validate the broader claims made during the presentation.
Watch the ICT Forex Price Action Lesson
The complete lesson is available at ICT Forex Price Action Lesson: Orderflow & Volume Imbalances. The video runs approximately 1 hour and 4 minutes and covers the Dollar Index case study from daily through 5-minute timeframes.
More ICT Forex Price Action Resources
- ICT Forex Price Action Lesson: Orderflow & Volume Imbalances the primary source for this article.
- Investopedia: Forex Volume general background on why spot forex does not provide a single comprehensive volume measure.
- Investopedia: Candlestick Chart general reference for candle body, open, close, wick and tail structure.




