
Key takeaways
ICT argues that conventional broken highs, broken lows, and support or resistance labels are useful but insufficient without a directional narrative built around presumed liquidity, price imbalance, and higher-time-frame context.
Read the full summary
ICT argues that conventional broken highs, broken lows, and support or resistance labels are useful but insufficient without a directional narrative built around presumed liquidity, price imbalance, and higher-time-frame context. Using a British pound chart across daily, hourly, and 15-minute time frames in TradingView, he distinguishes classic market structure from his own institutional market structure framework, temporarily hides wicks to emphasize candle opens and closes, identifies buy-side liquidity above highs and sell-side liquidity below lows, and treats some wicks as completed stop sweeps. At 10 minutes 27 seconds he describes large one-directional candles as imbalances that price may revisit, while overlapping imbalance and presumed sell-side liquidity provide a more specific downside objective. At 14 minutes 30 seconds he claims falling markets seek sell-side liquidity, rebalance an earlier move, or do both. On the 15-minute chart at about 18 minutes 58 seconds, he identifies a bearish order block after an estimated 80% retracement, a move above a short-term high interpreted as taking buy stops, and a decline toward the hourly objective. The article stresses that these are ICT’s unverified interpretations rather than standardized classifications or statistically proven mechanisms, and recommends separating observable candle data, methodology labels such as liquidity sweep and order block, and forecasts derived from those labels.
How we researched this article
BestProps used document-based research from primary firm sources, checked September 25, 2026. The complete source list, scope, limitations, and commercial-state record appear near the end of this article.
What ICT Means by Market Structure Is Not It
In Market Structure Is Not It, uploaded on May 13, 2021, ICT argues that conventional market structure is a useful framework but not a complete explanation of price movement. His central message is that traders should not treat broken highs, broken lows, or support-turned-resistance as self-sufficient signals. Instead, he says those observations should be interpreted within a broader “narrative” involving liquidity and price imbalance.
The presentation uses a British pound chart across daily, hourly, and 15-minute time frames. Because the source is generated captions and the chart itself is not contained in the transcript, this explanation can summarize ICT’s reasoning but cannot independently verify the displayed levels, candles, or forecast.
Classic Market Structure and the ICT Framework
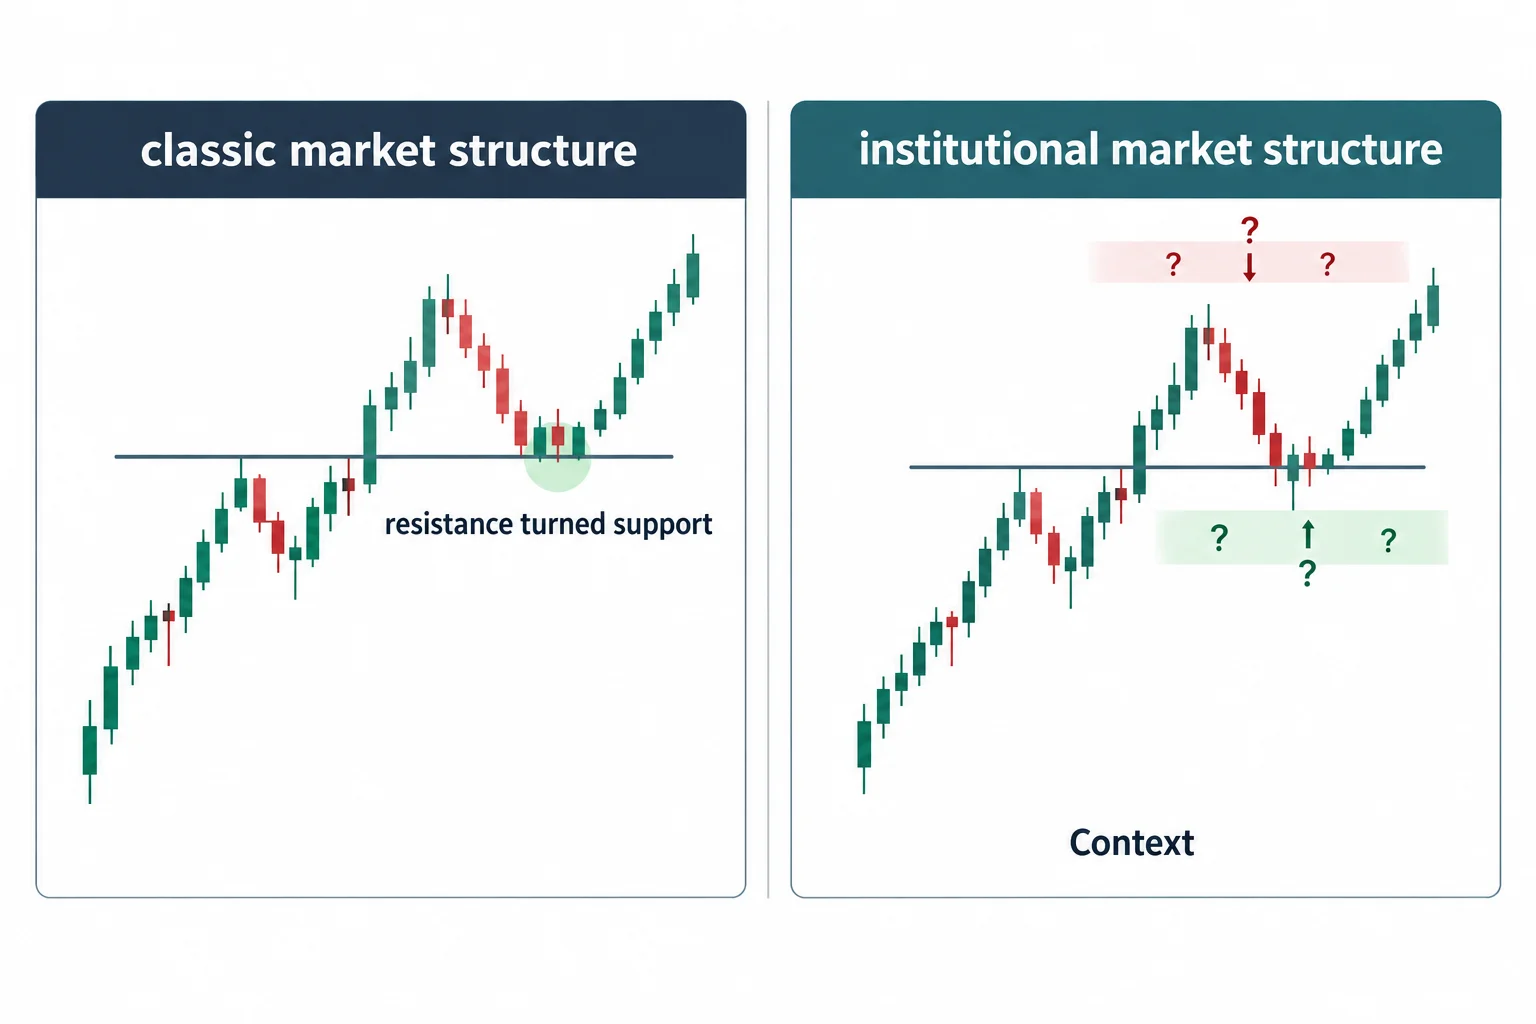
ICT introduces the main distinction at 3:15. He acknowledges that market structure provides a framework, but rejects the idea that it is a universal answer. He separates what he calls “classic market structure” from “institutional market structure.” These are ICT’s own teaching categories in this video, not standardized or independently validated market classifications.
In the classic interpretation, a previous high that is broken and subsequently revisited may be labeled resistance turned support. ICT discusses that familiar model at 5:51. He does not claim that such levels can never produce a reaction. In fact, he notes that daily and weekly levels may show sensitivity. His objection is to relying on that relationship without asking why price may be moving toward a particular area.
For ICT, the relevant questions are:
- Is price moving toward orders presumed to rest above a high or below a low?
- Is price returning through a range that was traversed primarily in one direction?
- Does the higher-time-frame context support the proposed direction?
- Is a visible wick meaningful, or does ICT interpret it as a completed stop run?
ICT Market Liquidity and Candle Bodies
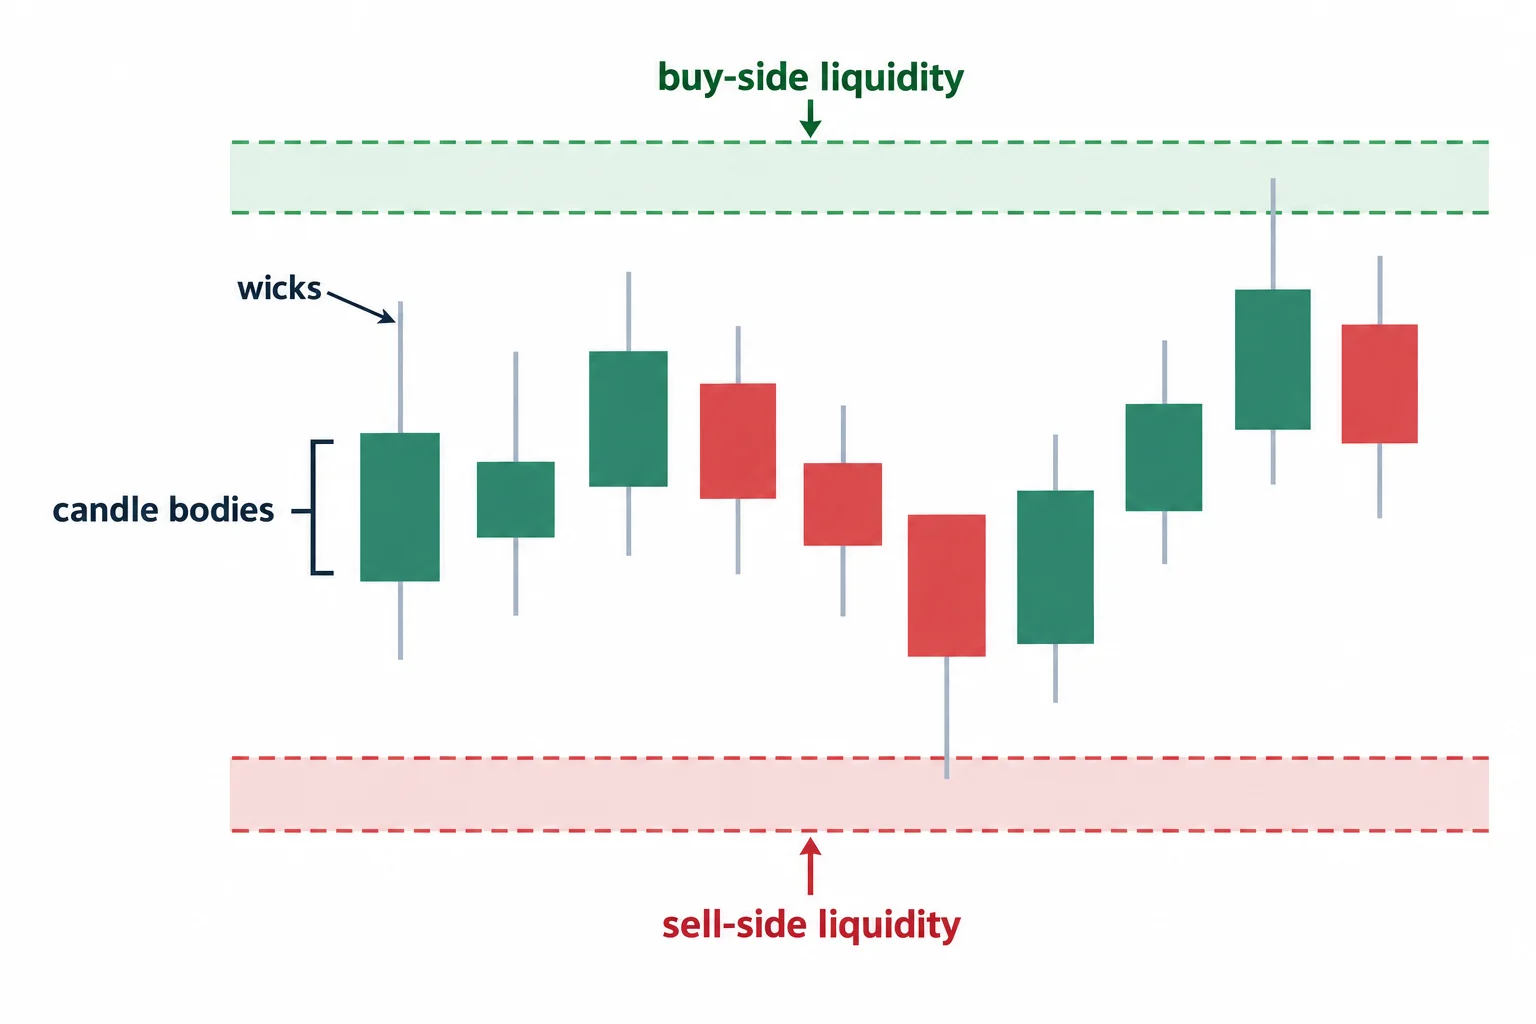
Beginning around 7:24, ICT explains that he initially studies candle bodies while temporarily ignoring wicks. In the example, he toggles wicks off in TradingView to emphasize opens and closes. He then interprets movement beyond prior candle bodies as a reach toward liquidity.
ICT associates “buy-side liquidity” with potential buying interest or stop orders above a reference high, and “sell-side liquidity” with potential stop orders beneath a low. The transcript does not provide order-book data identifying who placed such orders. Accordingly, these references should be understood as ICT’s interpretation of where orders may cluster, rather than proof of specific institutional positions.
His treatment of wicks is contextual rather than absolute. At first he removes them to clarify the bodies, but later restores them when discussing imbalance. On the hourly chart, he says he may disregard a wick if he interprets it as a sweep of stops beneath relative equal lows. Thus, the lesson is not simply “ignore all wicks.” It is that ICT assigns different significance to them depending on his narrative.
ICT Market Imbalance and Price Narrative
At 10:27, ICT moves from liquidity to imbalance. He describes a large, one-directional candle as leaving a range that price may later revisit or “rebalance.” In the daily example, he focuses on the space between surrounding candle references and argues that a decline into that area would address the prior one-sided move.
On the hourly chart, ICT combines two observations: a bullish candle that he regards as an imbalance and a swing low beneath which sell stops may be located. He argues that when an imbalance and presumed sell-side liquidity overlap, they can provide a more specific downside objective than a generic support or resistance level.
This leads to his clearest summary at 14:30: under his model, a falling market is either seeking sell-side liquidity, rebalancing an earlier move, or doing both. That is a strong interpretive claim made by ICT. The video does not present a statistical test establishing that all price declines can be exhaustively explained this way.
ICT Market Structure on the 15 Minute Chart
At approximately 18:58, ICT shifts to a 15-minute chart. He describes price returning into a prior one-sided decline, failing to reach an older low that a conventional structure analysis might emphasize, and then turning lower.
He subsequently labels the last up-close candle before the decline a bearish order block. Within his narrative, the setup includes a retracement into an imbalance, movement above a short-term high that he interprets as taking buy stops, and a decline toward the previously identified hourly objective. He estimates the retracement at roughly 80% but explicitly says he is eyeballing it rather than applying a Fibonacci tool. That figure should therefore be treated as an informal estimate, not an exact chart measurement.
Key ICT Market Structure Takeaways
The useful conceptual lesson is narrower than the title may initially suggest. ICT is not saying structure has no value. He is warning against using structure labels mechanically and in isolation. His preferred process is to form a directional narrative, identify presumed liquidity and imbalance, and then use lower-time-frame structure to refine that interpretation.
For study purposes, these elements should be kept separate: observed chart facts, such as candle opens and lows; labels supplied by the methodology, such as liquidity sweep or order block; and forecasts derived from those labels. Keeping those categories distinct makes it easier to review the framework critically without assuming that terminology alone demonstrates predictive reliability.
This is an educational summary of ICT’s stated market interpretation, not investment advice or a promise of trading performance.




