
How we researched this article
BestProps used document-based research from primary firm sources, checked September 25, 2026. The complete source list, scope, limitations, and commercial-state record appear near the end of this article.
What ICT teaches in “Liquidity Purge & Revert”
In ICT Price Action Lecture: Liquidity Purge & Revert, uploaded on November 14, 2020, ICT presents a short-term framework for studying what may happen after price trades through an old high or low. His worked example uses USD/CAD across daily, hourly, and 15-minute charts. Because the transcript cannot show the chart itself, this summary focuses on the stated process rather than reconstructing unseen prices.
The lesson is not framed as a conventional chart-pattern strategy. ICT says he interprets old highs and lows as locations where orders may be concentrated. Under his terminology, orders above an old high represent buy-side liquidity, while orders below an old low represent sell-side liquidity. Relative equal highs or lows can also serve as liquidity references. He introduces this terminology at approximately 4:22.
The purge-and-revert sequence
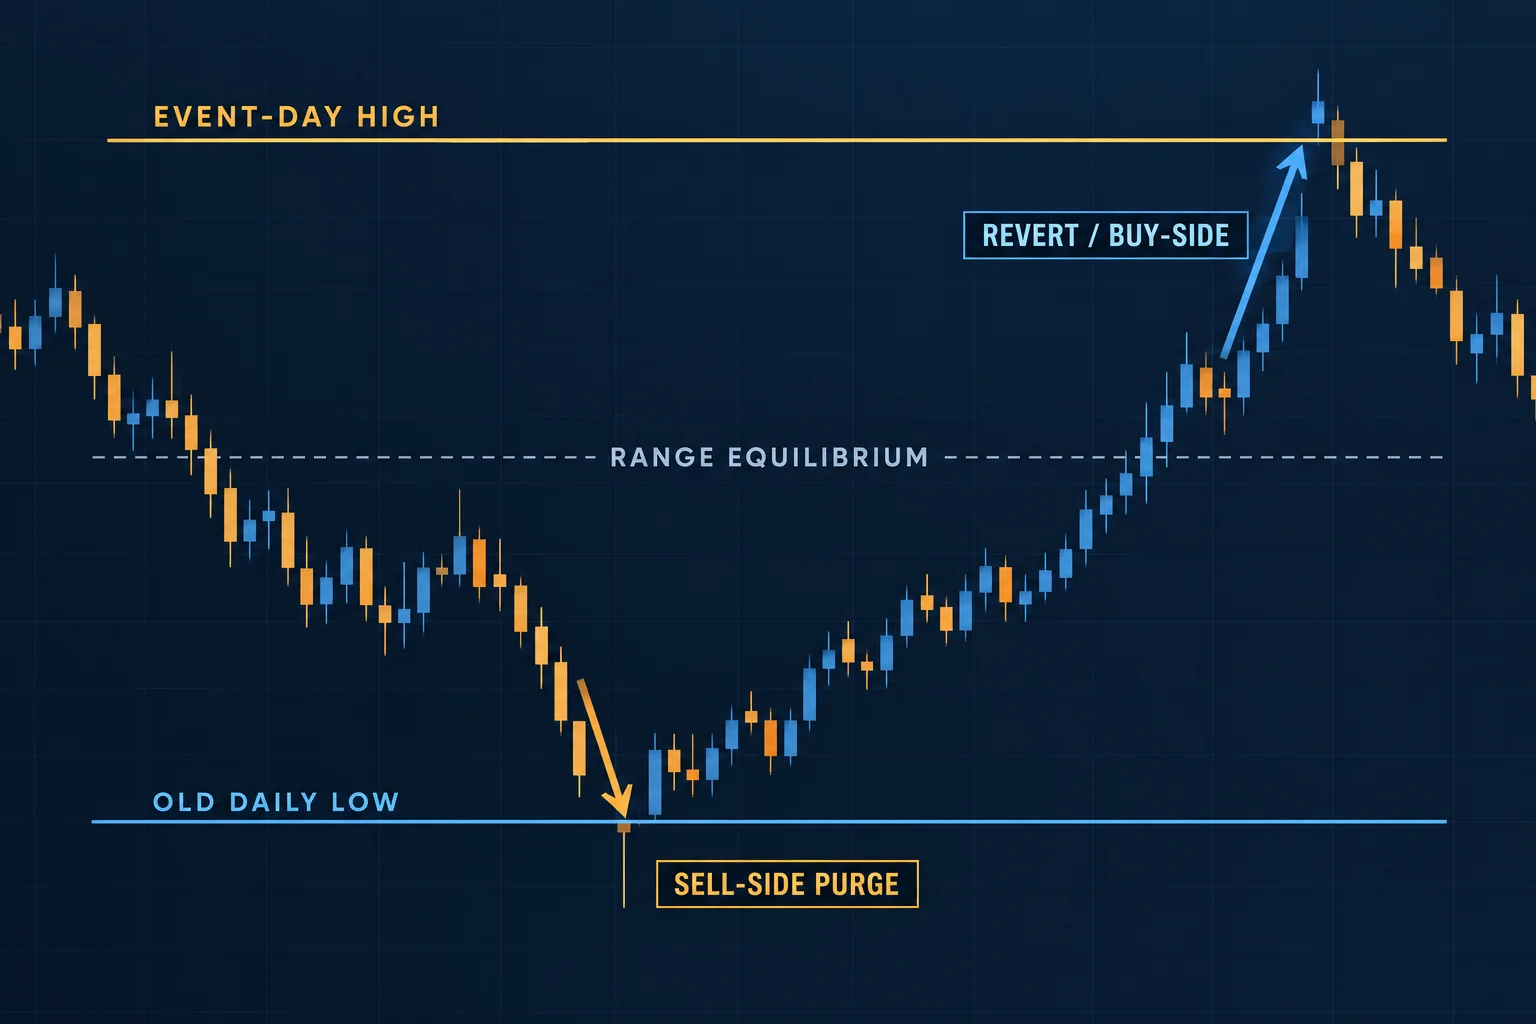
The principal example begins with price moving below an old daily low. ICT calls this a purge of sell-side liquidity. Importantly, the move through the low is not enough by itself to establish his proposed short-term directional bias. He waits for an additional condition: price must subsequently trade through the high of the day on which the purge occurred.
ICT labels that second event a market-structure break specifically within the liquidity-purge narrative. His explanation of the confirmation condition begins near 21:51, and he explicitly labels the event a market-structure break at 22:02. He explicitly notes that the condition is not guaranteed to succeed and describes the method as a sequence of conditional observations rather than a certainty.
Reduced to its main steps, the bullish version presented in the lecture is:
- Identify an old daily low with presumed sell-side liquidity beneath it.
- Observe price trade below that low, creating what ICT calls the liquidity purge.
- Mark the high of the purge day.
- Wait to see whether price trades through that high; ICT does not require a close above it in this example.
- If that happens, examine prior daily highs as possible opposing liquidity objectives.
- Filter those objectives using the midpoint of the relevant pre-purge range.
Watch the lecture
ICT Price Action Lecture: Liquidity Purge & Revert (YouTube)
If the embed does not load, open the video directly on YouTube.
ICT calls the movement toward the opposite side a revert, deliberately distinguishing it from a full reversal. The claim is limited to a possible short-term draw toward opposing liquidity; it is not necessarily a forecast that the larger trend has changed.
The fixed three-day lookback
The three-day lookback is introduced at 17:06, where ICT explains that the purge day counts as day one. The purge day is counted as day one. ICT then references liquidity associated with that day and the two preceding days rather than rolling the window forward every time a new day begins.
Later, at approximately 37:26, he restates the process: after a run below an old low and a break above the event-day high, attention shifts to previous daily highs. He relates the three-day rule to the common three-candle appearance of swing points—a central low with higher lows on either side, or a central high with lower highs on either side.
This is ICT’s interpretation of market structure, not independent proof that markets universally operate according to a three-day algorithm. The lecture encourages viewers to investigate historical charts, but it does not provide a controlled test, performance statistics, or a complete treatment of failure cases.
Equilibrium as a target filter
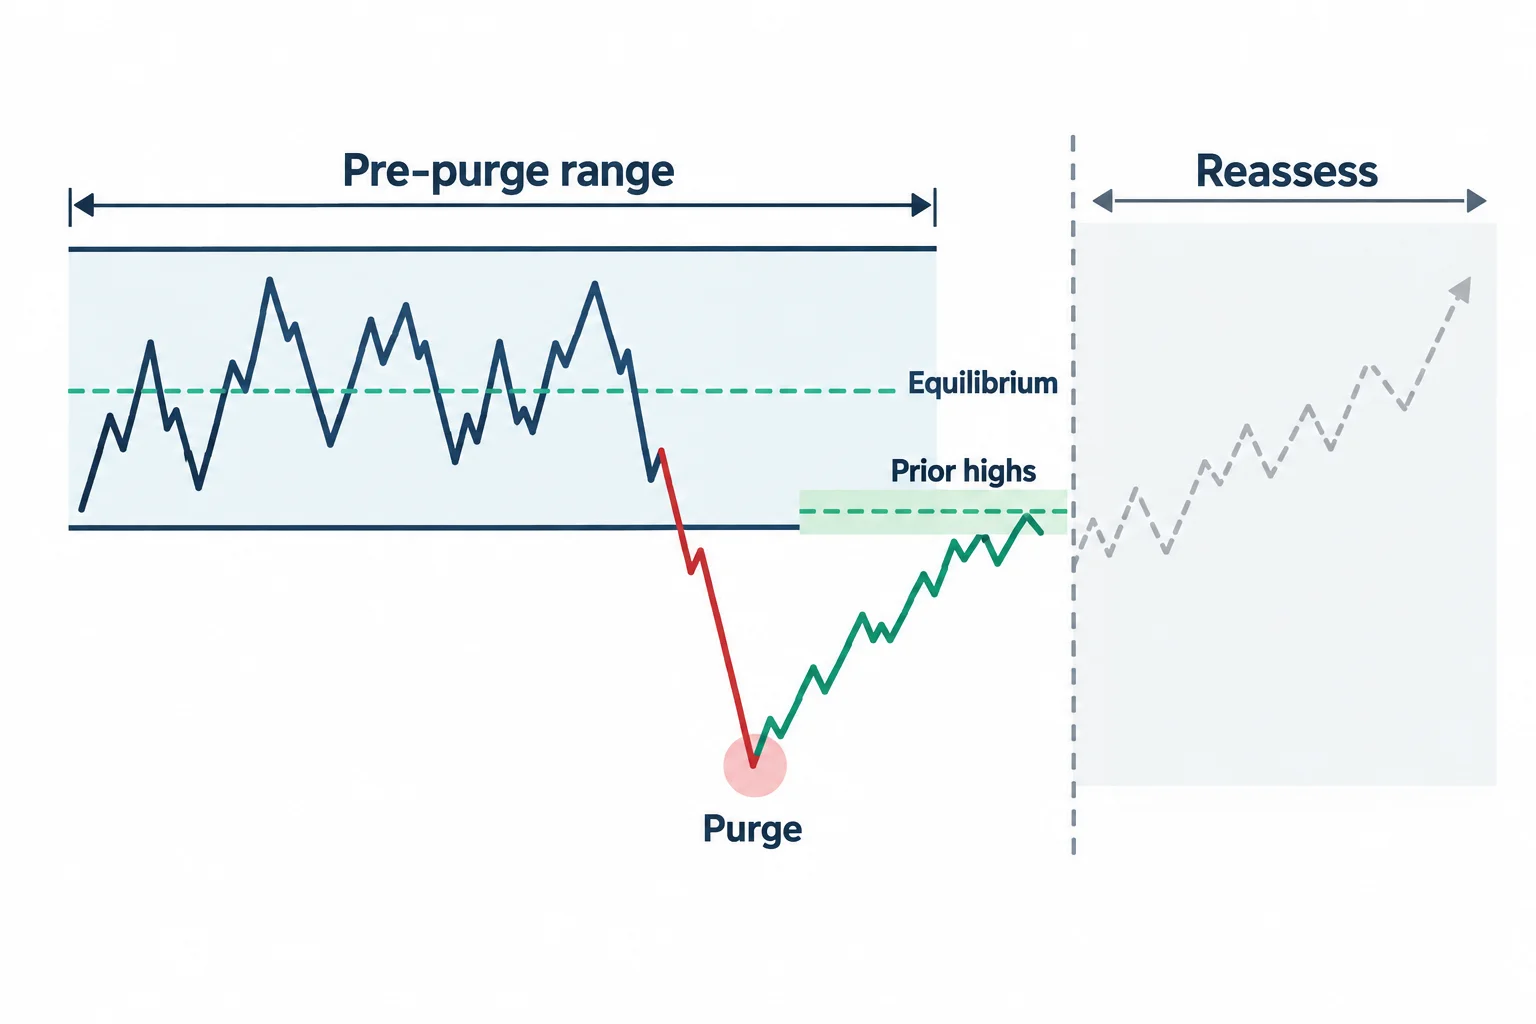
ICT also defines a clear range that existed before the purge and calculates its 50% midpoint, which he calls equilibrium. The range and midpoint discussion starts near 24:00.
In the bullish example, prior highs below or near equilibrium are treated as the more relevant short-term liquidity references. Once price reaches the midpoint, ICT says the original high-probability characterization weakens. Price might continue higher, but that continuation would require analysis beyond the limited model taught here.
He uses Fibonacci only as a convenient measuring tool for the 50% level, not as a harmonic pattern. He also makes a charting distinction later in the example:
- For measuring the complete range and its midpoint, he uses candle wicks and tails.
- For the lower-time-frame entry concept he calls an “optimal trade entry,” he says he prefers candle bodies.
That distinction appears around 31:58. It is part of ICT’s own chart-reading convention and should not be interpreted as an independently validated rule about where trading volume resides.
Time frames and the inverse setup
The lecture moves from a daily liquidity event to an hourly range and then to a 15-minute illustration. ICT separates trading days from midnight to midnight in New York time and uses each completed day’s highest high and lowest low. At 30:36, he explains that a candle beginning at midnight belongs to the new day rather than the prior daily range.
Although the detailed example starts with a purge below a low, ICT says the logic can be inverted. In the bearish version, a trader studying the model would watch for price to trade above an old daily high, then break below the purge day’s low, before considering previous lows as potential sell-side objectives.
A practical study checklist
For educational chart review, the lesson can be condensed into the following checklist:
- Mark conspicuous daily highs, lows, and clusters of relatively equal levels.
- Record whether one of those levels is traded through.
- Identify the purge day’s opposite extreme.
- Do not assume a revert unless that opposite extreme is subsequently breached.
- Keep the original purge day fixed as day one of the three-day reference window.
- Define the pre-purge range and mark its midpoint.
- Study opposing daily highs or lows within the stated threshold.
- Document failures and ambiguous examples rather than treating the sequence as automatic.
Resources
- ICT Price Action Lecture: Liquidity Purge & Revert (primary video)
- The Inner Circle Trader — official website
- ICT YouTube channel — official
Near the conclusion, ICT emphasizes that this is a framework for short-term intraday analysis, not a long-term market forecast. His concise recap begins at 36:50, and near the close he clarifies that the model frames short-term intraday bias rather than long-term direction at 44:11. The most careful takeaway is therefore procedural: identify a liquidity sweep, demand the stated confirmation, define a limited target area, and recognize where the model’s own probability claim is said to diminish. This is educational commentary on ICT’s interpretation, not investment advice or evidence of profitability.





