
Key takeaways
ICT presents a top-down bearish US Dollar Index thesis supporting long-side EUR/USD and GBP/USD ideas, using weekly and daily order blocks, mean thresholds, liquidity runs, optimal trade entry retracements, breaker zones, weekly expansion timing, and sentiment context.
Read the full summary
ICT presents a top-down bearish US Dollar Index thesis supporting long-side EUR/USD and GBP/USD ideas, using weekly and daily order blocks, mean thresholds, liquidity runs, optimal trade entry retracements, breaker zones, weekly expansion timing, and sentiment context. At 10 seconds he identifies Dollar Index downside references near 89.36 and potentially 87.00 to 87.50, while allowing retracements before continuation. At 2 minutes 23 seconds EUR/USD is framed as bullish after a run below prior lows, with Monday through Wednesday preferred for a bullish weekly-range low. At 5 minutes 34 seconds GBP/USD trades through and consolidates around the old weekly low at 1.3865, interpreted as accumulation, while overlapping candle-body retracements support upside continuation. At 9 minutes 4 seconds a stop run below a swing low followed by a return to two bullish candle bodies forms what ICT calls a bullish breaker, whose midpoint overlaps an optimal trade entry area on Tuesday. Weekly GBP/USD objectives discussed from 10 minutes 39 seconds include approximately 1.4191, 1.4200, and a mean threshold near 1.4380, though caption-derived values require visual confirmation. ICT uses contrary analyst commentary only to reinforce an existing chart view, not as a primary signal, and the transcript provides no auditable entries, exits, fills, costs, account results, or evidence of repeatable performance.
How we researched this article
BestProps used document-based research from primary firm sources, checked September 25, 2026. The complete source list, scope, limitations, and commercial-state record appear near the end of this article.
In ICT January 24, 2018, ICT presents a top-down reading of the US Dollar Index and then applies that directional premise to EUR/USD and GBP/USD. The video was uploaded on January 24, 2018; the transcript does not independently establish when the charts were recorded.
The central idea is that continued dollar weakness could support higher foreign-currency pairs. ICT illustrates that view with his concepts of order blocks, equilibrium or mean-threshold levels, liquidity around prior highs and lows, optimal trade entry retracements, and the timing of weekly range expansion. These are ICT’s interpretations of the displayed historical charts, not independently verified rules or evidence of a repeatable trading edge.
ICT Dollar Weakness Outlook
ICT begins with the weekly Dollar Index chart at 0:10. He identifies a prior down-close weekly candle as what he calls a bullish order block and discusses its open and midpoint as possible downside objectives. The generated captions render some of the quoted figures inconsistently, although 89.36 and a broader possibility of the 87.00–87.50 area are reasonably clear.
After moving to the daily chart, he says the index had broken lower, revisited the 91 area, and resumed declining. In his framework, price had entered the weekly order block and was approaching its mean threshold. He does not claim that the dollar had to move directly to the lower objective; he explicitly allows for retracements before any continuation.
At 2:14, ICT connects this bearish dollar premise to foreign currencies: if the dollar remains weak, that would, in his view, provide a supportive backdrop for pairs such as EUR/USD and GBP/USD.
ICT EUR/USD Liquidity and Dollar Weakness
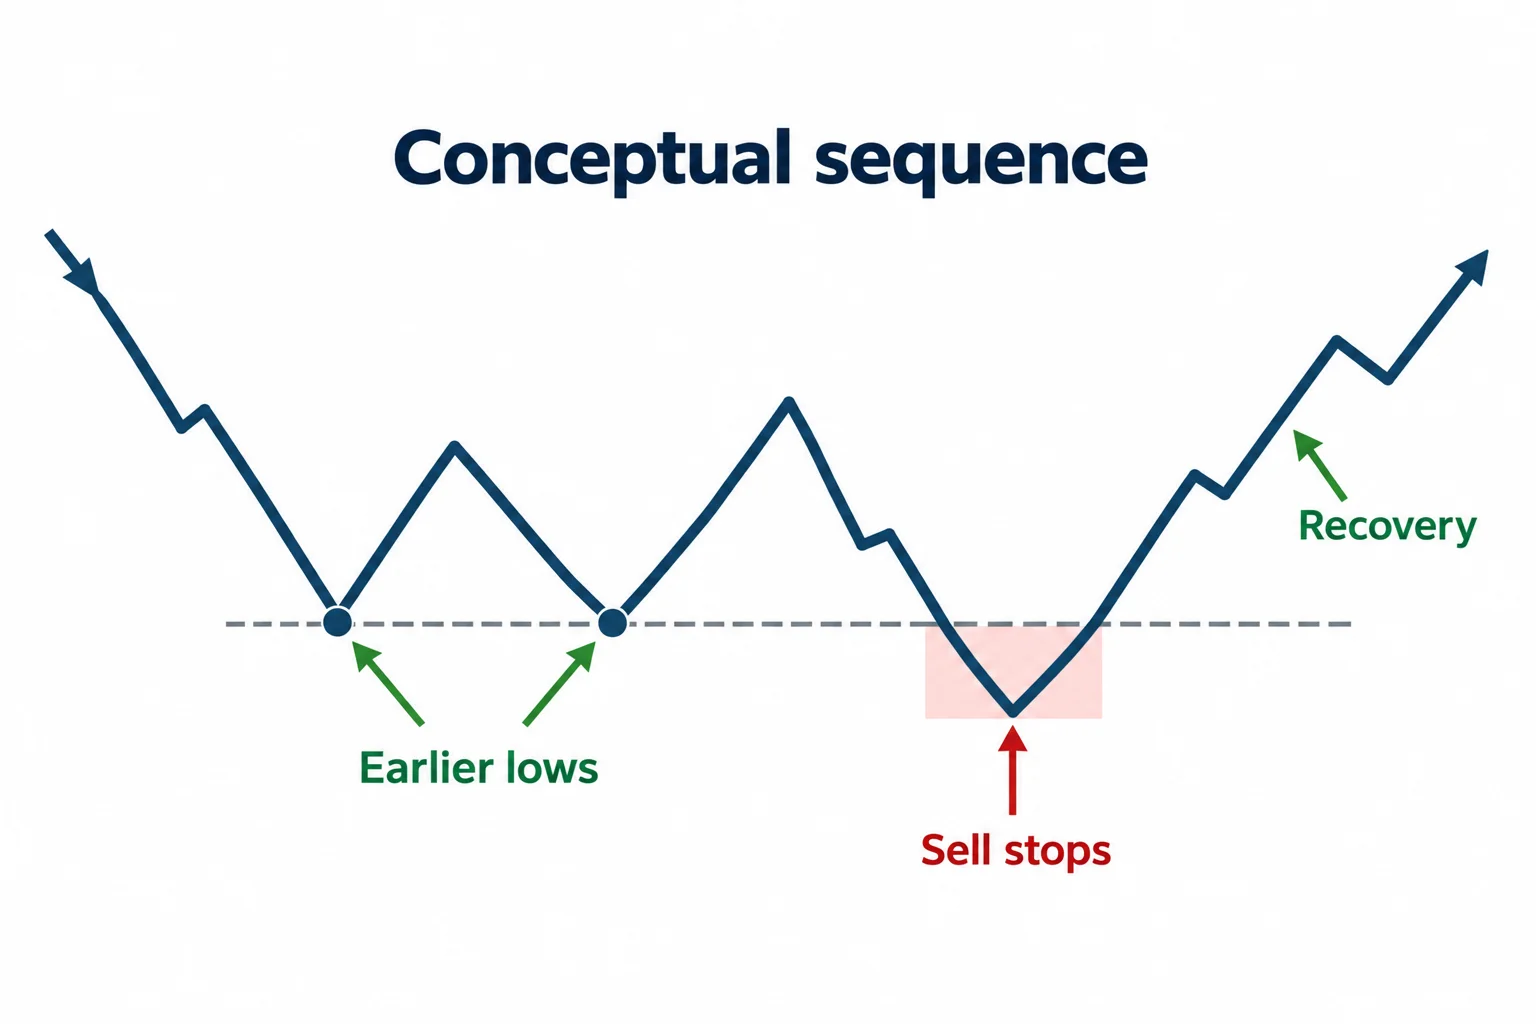
On the EUR/USD hourly chart at 2:23, ICT describes a move below earlier lows as a run on sell stops. He then treats the subsequent action as supportive of a long-side thesis. He also points to Monday through Wednesday as the portion of the week in which he preferred to look for the low of a bullish weekly range.
A second theme is his use of financial commentary as a sentiment gauge. Beginning around 3:33, ICT explains that when analysts express a strong one-way expectation, he may consider the opposite view if it already agrees with his chart analysis. He gives the example of a bearish EUR/USD call that conflicted with his weak-dollar premise.
This distinction matters: ICT says he does not use news headlines as the primary signal. Instead, he uses them to assess sentiment and to increase his confidence when a widely expressed opinion opposes his pre-existing technical reading. The transcript reports that the euro subsequently advanced and that a substantial move was available, but it does not document an independently auditable entry, exit, fill, account result, or trading cost.
ICT GBP/USD Levels and Dollar Weakness
ICT turns to GBP/USD at 5:34. He focuses on 1.3865, described as an old weekly low that had become an upside objective. After price moved through and consolidated around that level, he interprets the area as accumulation rather than straightforward resistance.
Within the consolidation, he measures equilibrium from candle bodies and identifies overlapping retracements that he calls optimal trade entries. He argues that the broader bearish-dollar premise made upside continuation in GBP/USD more likely than a complete reversal from nearby equal highs.
At 7:42, he demonstrates the retracement process using the lowest and highest candle opens or closes rather than simply using wick extremes. The captions describe a “60% tracing level,” which is likely a recognition error for a retracement level; the exact intended Fibonacci specification should be checked against the visible chart and ICT’s other definitions.
ICT Breaker Levels Explained
The most detailed structural example begins near 9:04. ICT describes price falling through an earlier swing low, removing stops, then rallying and returning toward the bodies of two bullish candles. He labels that zone a bullish ICT breaker. Its midpoint, or mean threshold, overlaps one of his optimal trade entry areas and occurs on Tuesday, which he considers consistent with bullish weekly expansion.
He then moves to a weekly GBP/USD chart at 10:39. There he identifies the last up-close candle before the sharp Brexit-related decline as a bearish order block. The captions render the associated levels as approximately 1.4191, the 1.4200 figure, and a later mean-threshold objective near 1.4380. Because these values come from generated captions and the chart itself is not reproduced in the transcript, they should be confirmed visually in the source video.
ICT Dollar Trading Lessons
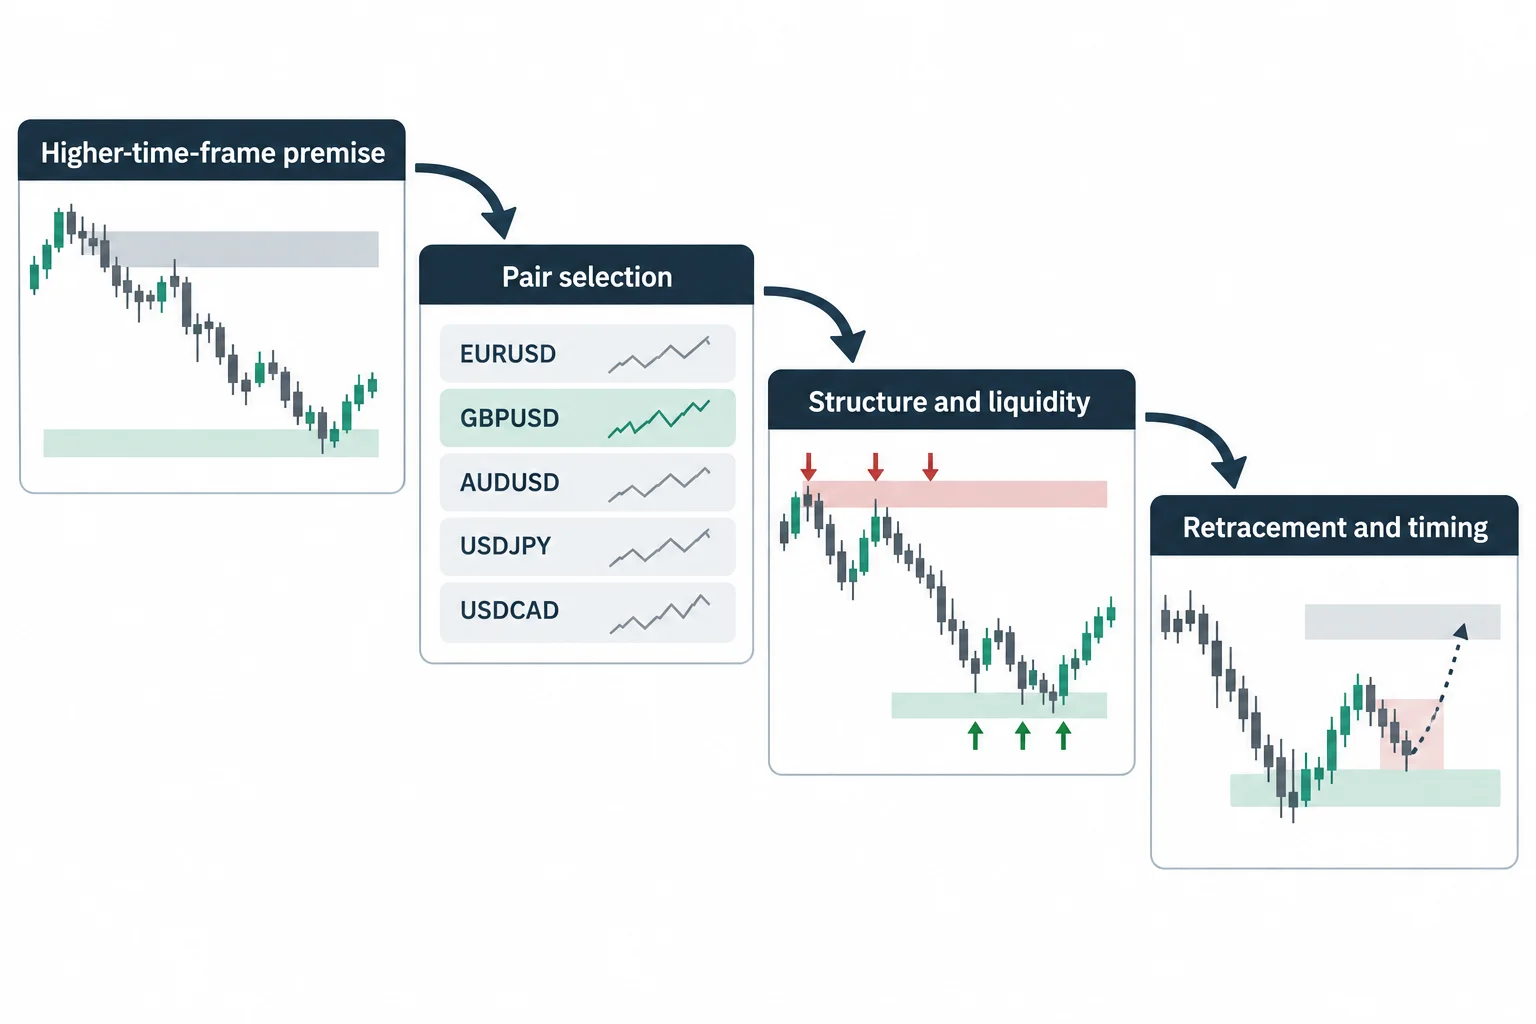
The session demonstrates a structured top-down process rather than an isolated entry pattern:
- Form a directional premise from a higher-time-frame market such as the Dollar Index.
- Use that premise to narrow the preferred direction in related currency pairs.
- Mark prior highs, lows, candle-based zones, and range midpoints.
- Wait for lower-time-frame retracements and liquidity events that fit the broader view.
- Consider the day of the week and the anticipated direction of weekly expansion.
- Treat news commentary as sentiment context rather than as a standalone trigger.
ICT closes by emphasizing patience and the value of aligning day trades with a higher-time-frame premise. For study purposes, the useful takeaway is the hierarchy of his analysis: broad dollar view first, pair selection second, then structure, liquidity, retracement, and timing. The video does not establish how these concepts perform across different samples or market conditions, so it should be treated as commentary on a specific historical chart sequence rather than investment advice or a performance promise.





