
How we researched this article
BestProps used document-based research from primary firm sources, checked September 19, 2026. The complete source list, scope, limitations, and commercial-state record appear near the end of this article.
In ICT Index Futures PM Session Review – 06/13/2022, ICT reviews the afternoon action in the S&P and Nasdaq index futures. The lesson focuses on how the lunch-hour rally, a break in short-term structure, and subsequent fair value gap retracements fit his interpretation of a bearish continuation day.
This is a brief chart review rather than a complete trading system. The captions do not disclose chart symbols, exact visible prices, actual fills, or independently verified results. The discussion is best understood as an explanation of how ICT annotated that session after the fact.
Begin with independent chart study
At 0:22, ICT asks viewers to add their own observations rather than simply copying his annotations. His stated purpose is review, with an emphasis on developing the ability to examine price action independently.
That instruction matters because the concepts presented later—liquidity, market-structure shifts, and fair value gaps—depend on how a trader defines the relevant swing points. Two viewers can select different short-term highs or gaps while looking at the same session. The video acknowledges this discretion when ICT notes that viewers may choose the gap with which they are most comfortable.
The broader bearish context
Beginning at 0:54, ICT characterizes June 13 as a large down day that began from the Sunday opening gap. According to his narration, price did not first attempt to fill that gap before moving below the daily low. He refers viewers to the separate morning-session review for fuller context.
The afternoon lesson therefore starts with a bearish directional backdrop already established. ICT then highlights a lunch-hour rally back toward an older daily low and above the 9:30 a.m. opening price. In his framework, the rally was not automatically evidence of a lasting reversal. Instead, he interprets it as a possible move toward resting buy-side liquidity before downside continuation.
Lunch-hour liquidity and the morning high
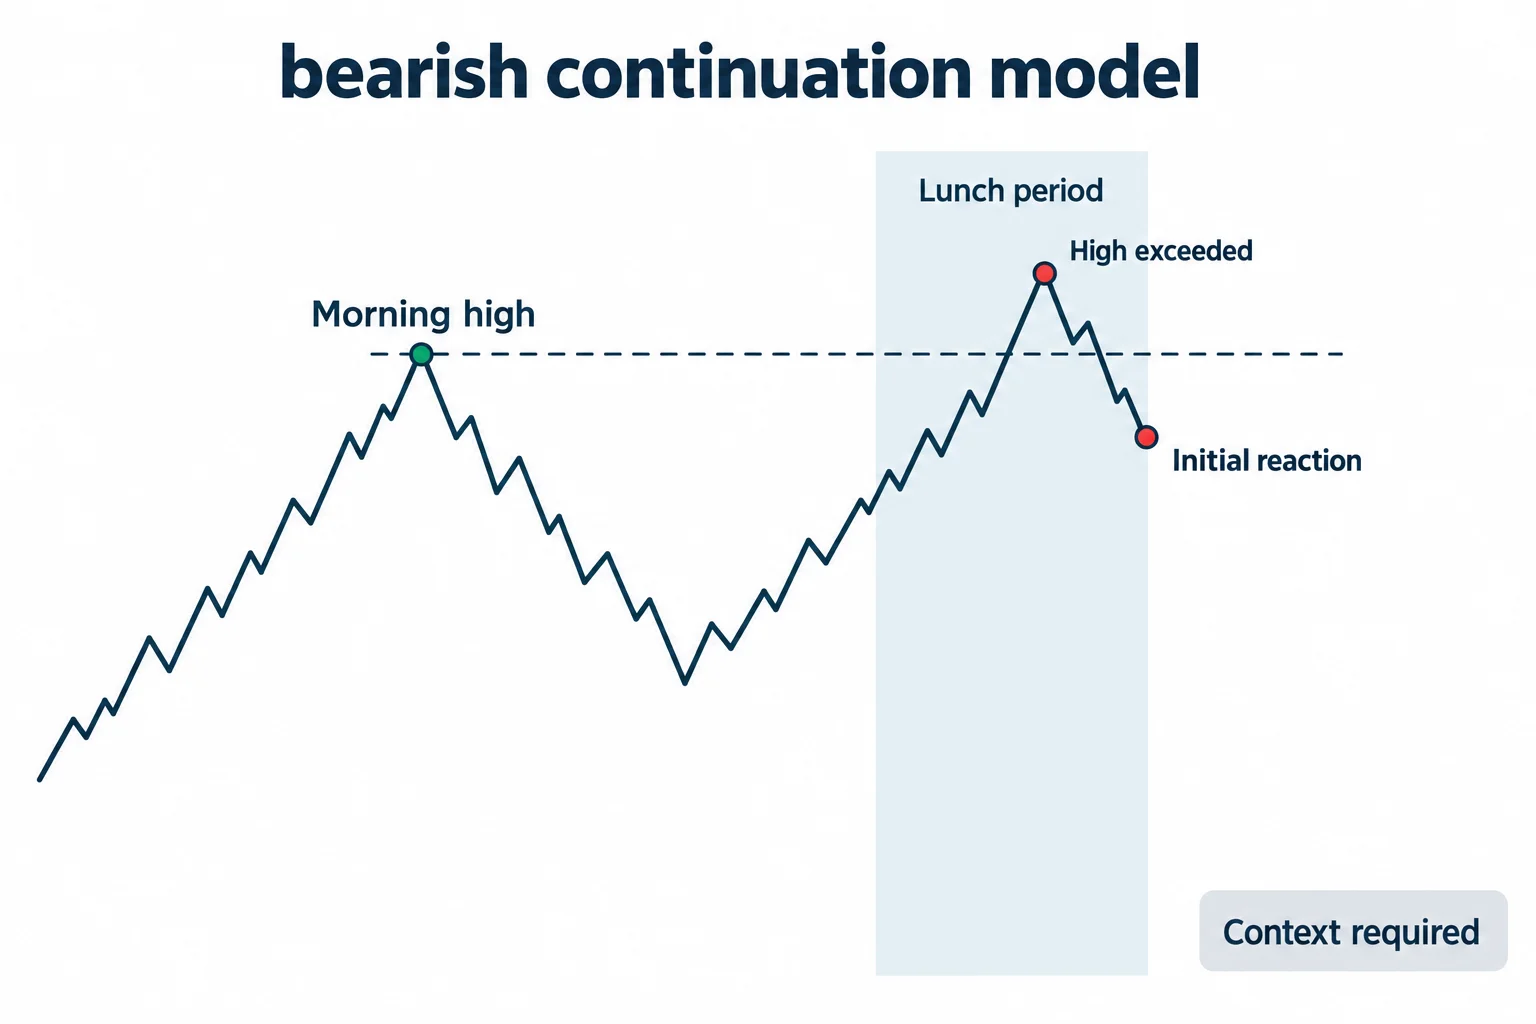
At 1:20, the review turns to the lunch period. ICT says price rallied to an old daily low and later moved through a short-term morning high. He frames the taking of that high during or shortly after lunch as consistent with a bearish continuation model: price first reaches above a nearby high, then reverses lower.
This is ICT’s market interpretation, not proof that every lunch-hour sweep predicts a decline. As a general educational point, a high being exceeded only establishes what price did; the subsequent reaction, structural break, and broader context determine how a particular methodology labels the event.
Structure shift and fair value gaps
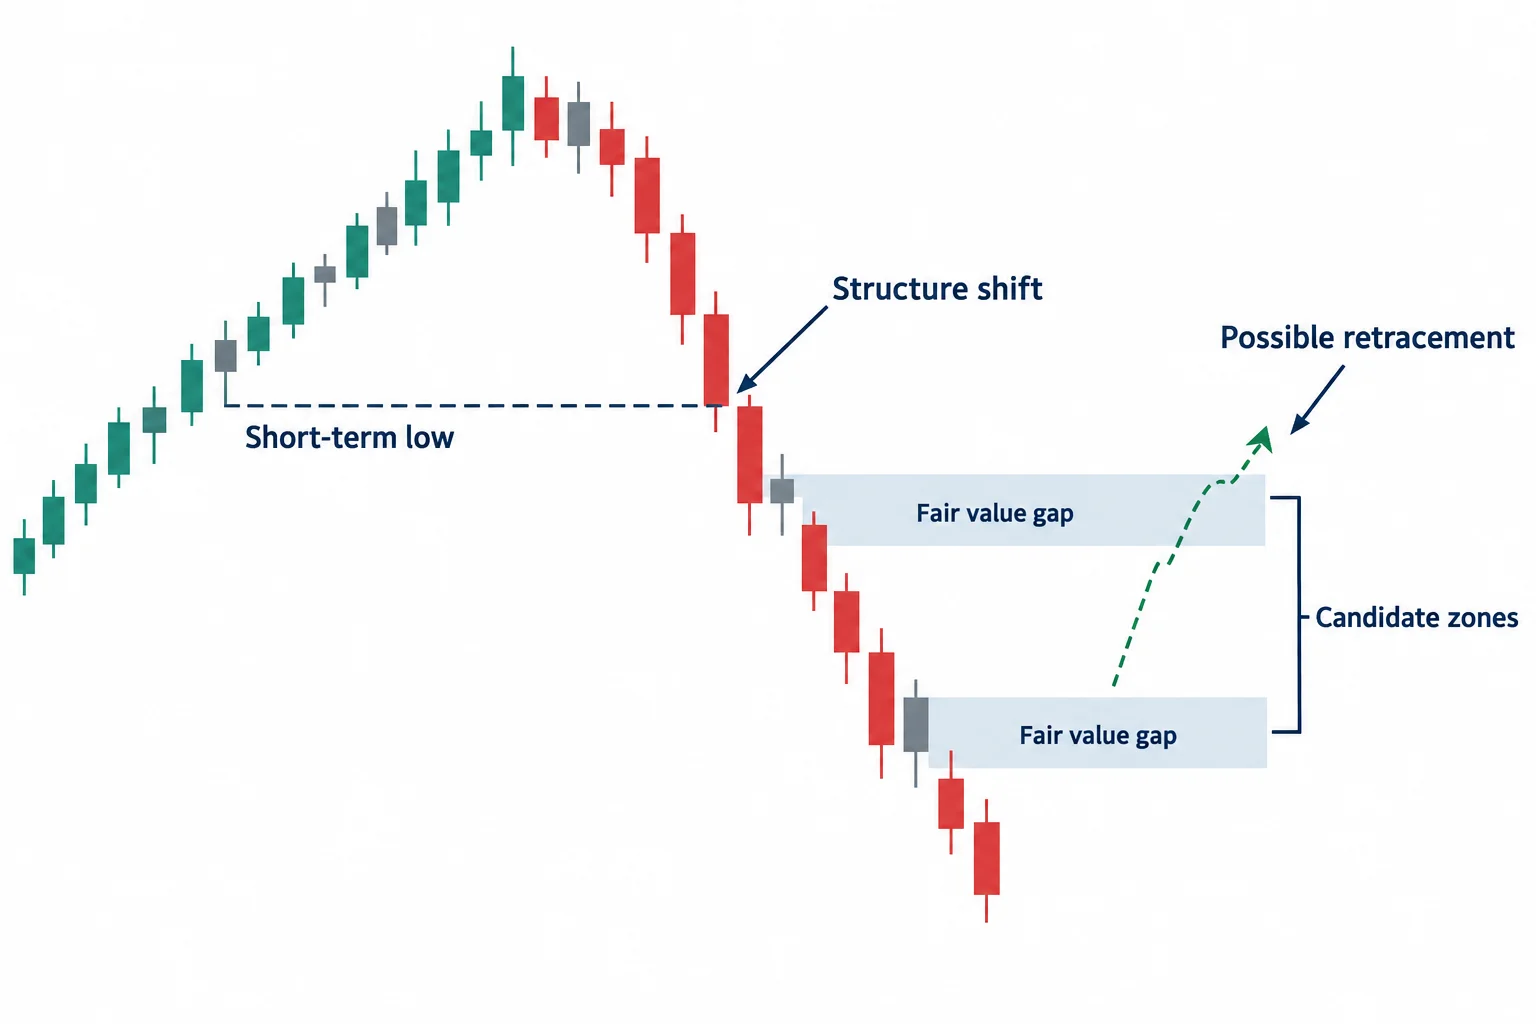
After the rally, ICT identifies a break below a short-term low as a shift in market structure. At 2:01, he begins discussing gaps that could be used to study the retracement. The generated captions briefly say “favorite gap,” but the surrounding discussion and repeated terminology indicate that he is referring to a fair value gap.
ICT points to two possible fair value gaps following the structural break. He discusses examining candle bodies and allowing for the possibility that price could reprice farther into the imbalance. He also marks a chart-based invalidation area and describes downside liquidity as the objective in his model. Because the chart values are not present in the transcript, the video does not support reconstructing a precise entry, stop price, or reward-to-risk calculation from captions alone.
Nasdaq comparison
At 2:51, ICT says the Nasdaq displayed a similar sequence:
- A move through the morning high during the lunch period.
- A return toward an old daily low that had already been traded through.
- A break below a short-term low.
- A retracement into the first fair value gap.
- A later move toward downside liquidity approaching the 4:00 p.m. New York close.
He notes one difference: Nasdaq did not reprice into the farther area he considered possible. This distinction illustrates that a projected retracement zone is not guaranteed to trade. In ICT’s reading, the nearer fair value gap was enough before price continued lower.
Why ICT says to review both sessions
ICT closes at 3:34 by saying the afternoon review is incomplete without the morning session. He presents both reviews as material for education, backtesting, and journaling.
A practical study process is to annotate the morning range, the 9:30 a.m. opening price, prior daily levels, lunch-hour highs, short-term swing lows, and any later imbalances. Those annotations can then be compared with ICT’s narration. This does not validate the framework or establish profitability, but it helps separate what appeared on the chart from the interpretation applied afterward.
This summary is educational commentary on the video transcript. It is not investment advice or a performance claim.





