
Key takeaways
The Inner Circle Trader’s three minutes 40 seconds ICT Index Futures AM Session Review for June 14, 2022 analyzes S&P and Nasdaq futures with a bearish daily bias after both crossed the prior day’s low, then uses five-minute charts to trace an 8 thirty rally toward buy-side liquidity, failure near the 9 thirty New York…
Read the full summary
The Inner Circle Trader’s three minutes 40 seconds ICT Index Futures AM Session Review for June 14, 2022 analyzes S&P and Nasdaq futures with a bearish daily bias after both crossed the prior day’s low, then uses five-minute charts to trace an 8 thirty rally toward buy-side liquidity, failure near the 9 thirty New York equities open, a bearish market structure shift, retracement into a fair value gap, and downside objectives at short-term lows and the previous day’s low. ICT calls Nasdaq’s initial countertrend rally a Judas swing, emphasizes candle-body interaction with the gap over exact wick precision, discusses hypothetical stops beyond the relevant swing high, and describes the retracement as premium relative to the 8 thirty and 9 thirty reference points. He closes at three minutes 13 seconds by reiterating short-term lows as targets, declining an afternoon review, and urging caution before the Wednesday FOMC event. The review shows no verified fills, complete chart annotations, subsequent outcome, repeatable edge, or profitability evidence and is educational commentary rather than investment advice.
How we researched this article
BestProps used document-based research from primary firm sources, checked September 25, 2026. The complete source list, scope, limitations, and commercial-state record appear near the end of this article.
In ICT Index Futures AM Session Review – 06/14/2022, ICT reviews the morning price action in the S&P and Nasdaq index futures. He begins with a bearish daily-chart interpretation, then moves to five-minute charts to explain how he identified liquidity, a market structure shift, a fair value gap and downside objectives.
This is a summary of ICT’s interpretation of the session, not independent confirmation that the described setup provides a repeatable trading edge. The generated captions also do not show the chart annotations, actual fills or what occurred after the review ended.
ICT Session Context and Bearish Bias
At 0:07, ICT introduces side-by-side daily charts, with the S&P on the left and Nasdaq on the right. He characterizes both markets as continuing lower. In his account, Nasdaq returned to an older low while the S&P did not, but both moved through the prior day’s low.
ICT therefore frames the session with a bearish bias. He identifies the previous day’s low as the first expected draw on liquidity and says both markets reached it. This establishes the top-down logic for the rest of the review: begin with directional context on the daily chart, then examine whether intraday price action offers a setup aligned with that context.
ICT Session Five-Minute Sequence
ICT changes to the five-minute charts at 0:44 and briefly invites viewers to pause before he reveals his annotations. His explanation then follows a sequence:
- The broader bias remained bearish.
- Price first rallied toward what the captions appear to identify as buy-side liquidity.
- After another push and failure, price broke lower around the 9:30 New York equities open.
- ICT interprets that decline as a short-term market structure shift.
- Price then retraced into a fair value gap before moving back toward short-term lows and the previous day’s low.
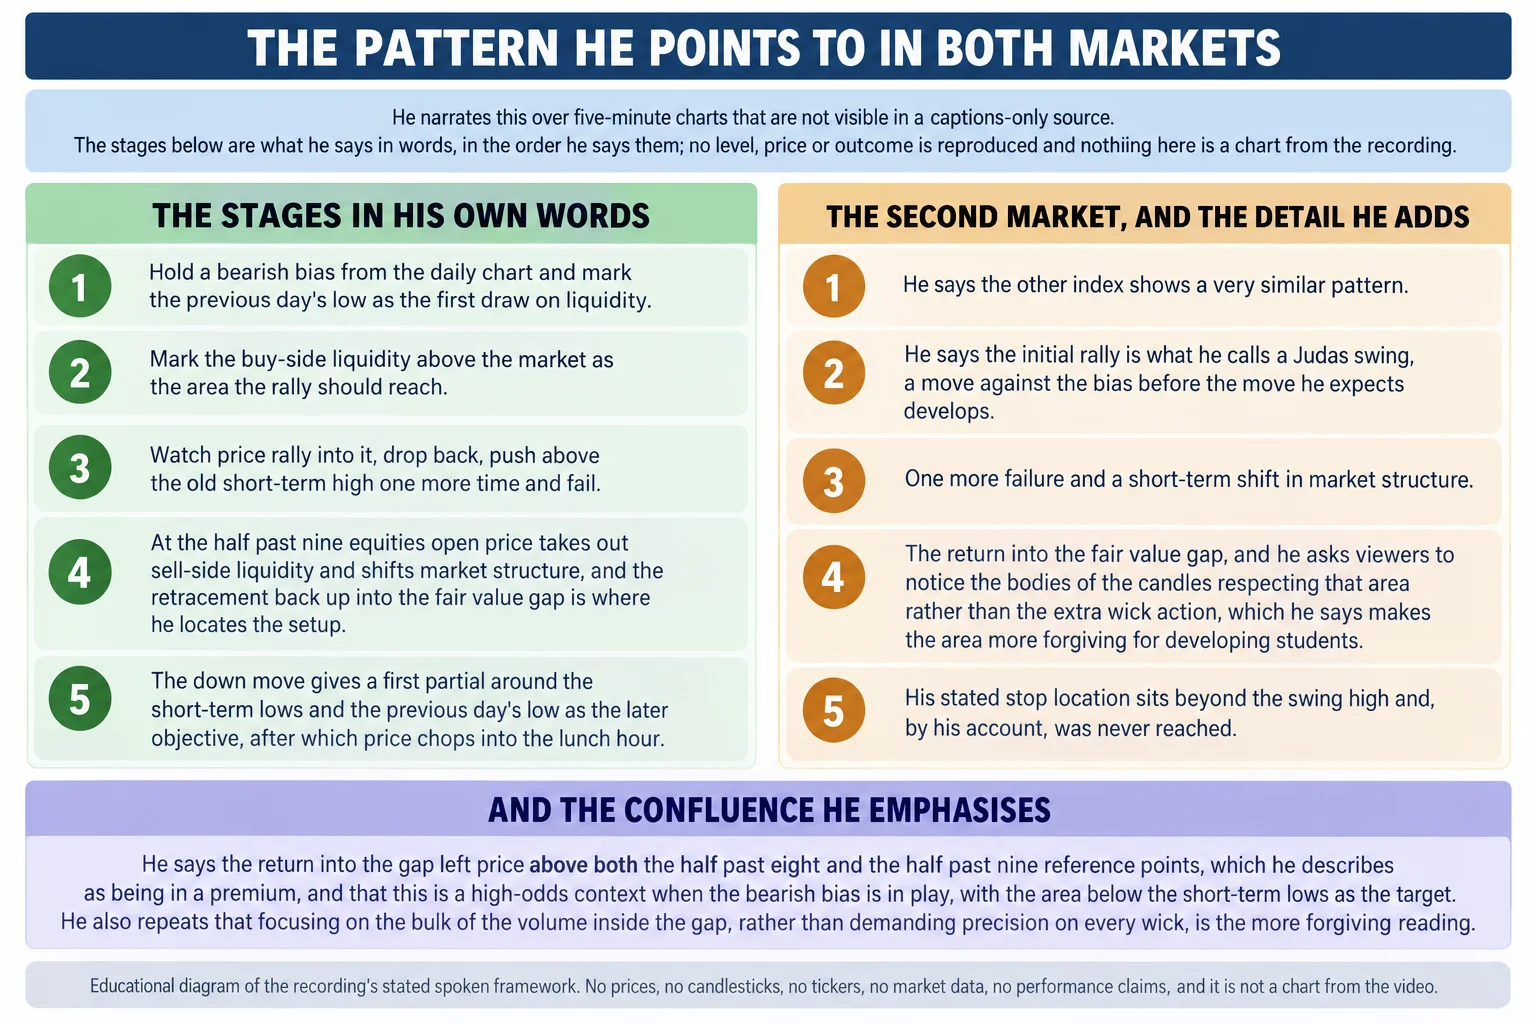
The S&P discussion begins around 0:58. ICT describes a rally from the 8:30 period, a subsequent break lower and a retracement into a fair value gap. He presents the nearby short-term low as a possible first partial objective and the previous day’s low as a later objective. By the time of the recording, he says price had become choppy approaching the New York lunch hour.
ICT Index Session Nasdaq Comparison
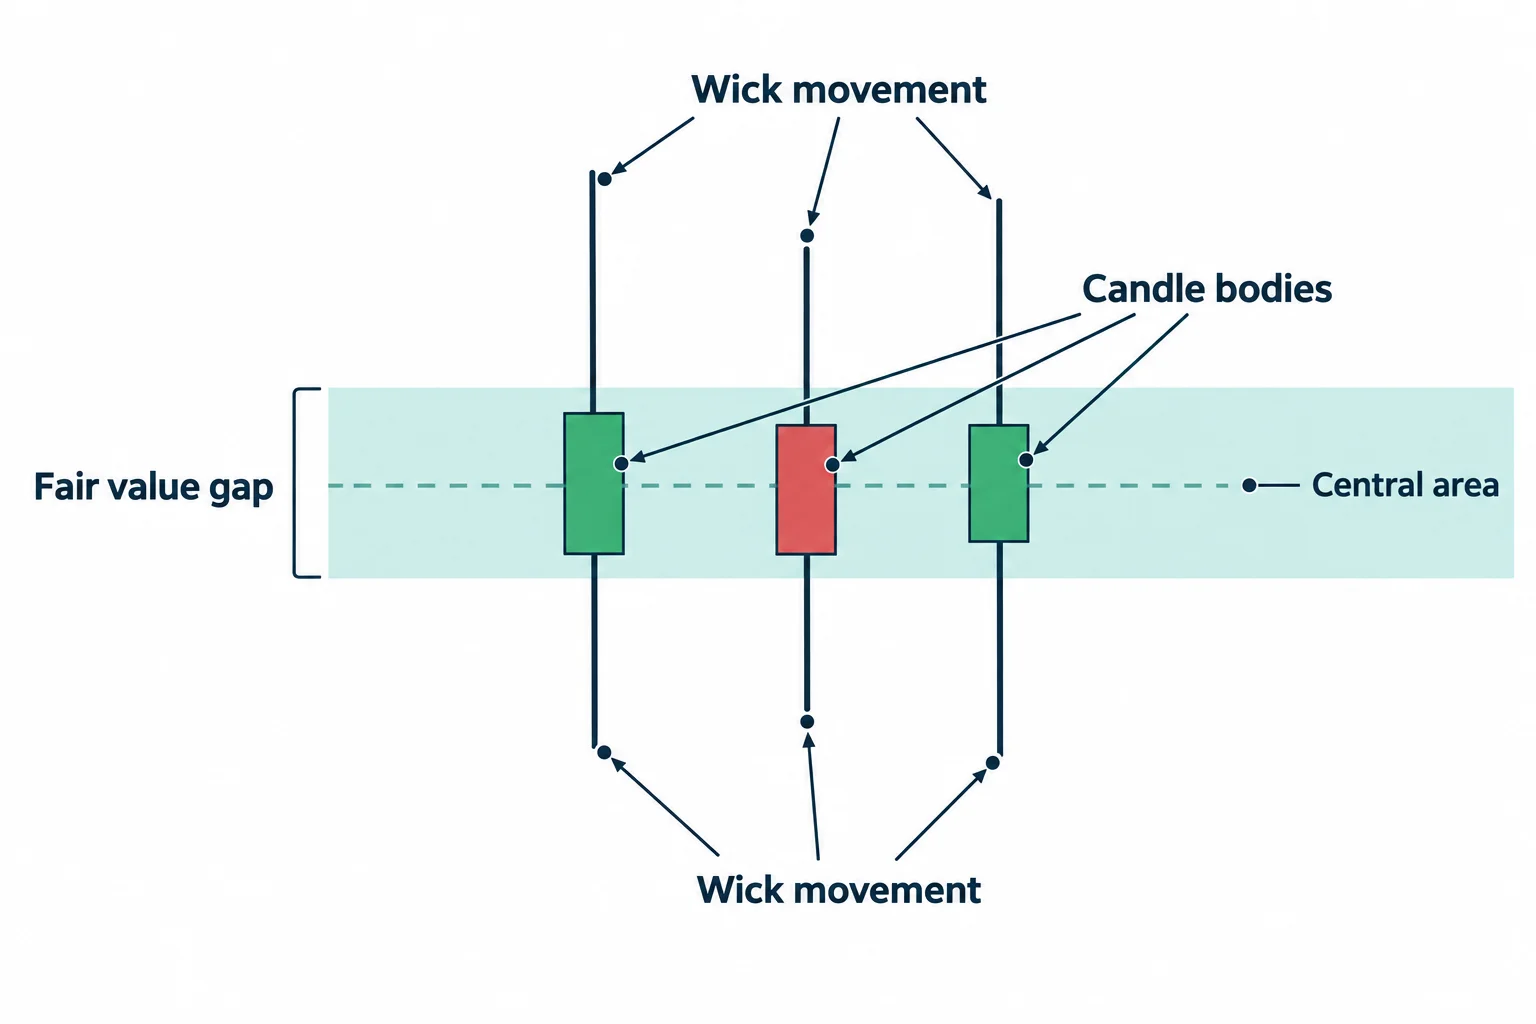
At 1:52, ICT says Nasdaq displayed a similar pattern. He labels the initial rally a “Judas swing,” meaning an early move opposite his anticipated direction before the bearish move developed. He then points to a failed rally, a short-term structure shift and a return to a fair value gap.
One of the more specific teaching points appears at 2:07. ICT asks viewers to notice how the candle bodies interacted with the fair value gap. He distinguishes the bodies from the additional wick movement and argues that focusing on the central area can be more forgiving for developing students than demanding exact precision from every wick.
ICT also discusses hypothetical stop placement beyond the relevant swing high. Because the transcript does not reveal an executed order or fill, this should be understood as a chart-review example rather than documentation of a completed trade.
ICT Index Futures Downside Objectives
Near 2:56, ICT returns to the timing of the 9:30 equities open and the earlier 8:30 reference. He says the retracement into the fair value gap placed price in what he calls a premium relative to both reference points. Within his bearish framework, he views that premium retracement as favorable context for looking toward liquidity below short-term lows.
The key idea is confluence rather than any single chart label. ICT combines a higher-time-frame bearish bias, an intraday rally toward liquidity, a downside structure shift, a retracement into an imbalance and lower liquidity objectives. These are ICT’s market interpretations; the short review does not test how often the sequence works or establish its profitability.
ICT Index Futures Trading Takeaways
Separate from the specific session, the video illustrates a structured review process:
- Define directional context from a higher time frame.
- Mark prior highs, lows and other potential liquidity references.
- Wait for lower-time-frame behavior that agrees with the original thesis.
- Use a retracement area to organize the hypothetical setup.
- Identify intermediate and final objectives before evaluating the move.
ICT closes at 3:13 by reiterating that short-term lows were the downside target. He also says he would not provide an afternoon review and urges caution and observation ahead of the Wednesday FOMC event referenced in the recording.
This article is educational commentary on the transcript and is not investment advice or a recommendation to trade futures.
ICT Index Futures Session Resources
These resources provide background on the concepts ICT references in the video. They are provided for context only and are not endorsements.
- Primary source: ICT Index Futures AM Session Review – 06/14/2022 on The Inner Circle Trader’s channel.
- A general explanation of fair value and how the “fair value gap” concept relates to temporary buyer/seller imbalance may help frame the retracement ICT describes.
- For the concept of swing highs and lows that ICT uses when placing stops and objectives, see Investopedia’s definition of a swing.
Unofficial educational context: the terms above are explained by third parties and are provided to help readers understand the concepts ICT references; they are not ICT’s own materials.
This article is educational commentary on the transcript and is not investment advice or a recommendation to trade futures.




