
Key takeaways
ICT reviews a GBP/USD intraday short framework built on a range-bound US Dollar Index, a London-session rally, a run above an old 60-minute high near an unverified 1.29193, and a bearish structure shift during the New York Open Killzone from eight thirty a.m.
Read the full summary
ICT reviews a GBP/USD intraday short framework built on a range-bound US Dollar Index, a London-session rally, a run above an old 60-minute high near an unverified 1.29193, and a bearish structure shift during the New York Open Killzone from eight thirty a.m. to eleven a.m. Eastern. The setup requires price to break the swing low preceding the liquidity run, then retrace toward the low or body of the down-close candle defined as a breaker. ICT also identifies a 70.5% optimal trade entry retracement and a 1.5 standard-deviation objective, while stressing that Fibonacci alone is insufficient without the broader session narrative. The target was sell-side liquidity just beneath the London low rather than an extended decline because consolidation favored mean reversion, and ICT advocated partial profit-taking while reporting that he banked 20 pips. The transcript does not independently verify the chart, level, execution, profitability, or broader claims about market control.
How we researched this article
BestProps used document-based research from primary firm sources, checked September 25, 2026. The complete source list, scope, limitations, and commercial-state record appear near the end of this article.
In ICT Forex Price Action Lesson: GbpUsd Trade Recap & Price Action Lecture, uploaded September 16, 2020, ICT reviews a GBP/USD intraday setup around the New York session. His central lesson is that a trader should first classify the broader market conditions, then use liquidity, market structure and time of day to frame a possible entry.
The discussion reflects ICT’s own interpretation of price action. The transcript does not independently establish the accuracy or profitability of the methodology, and the unseen chart cannot be verified from captions alone.
ICT Forex Scalp Trades in Consolidation
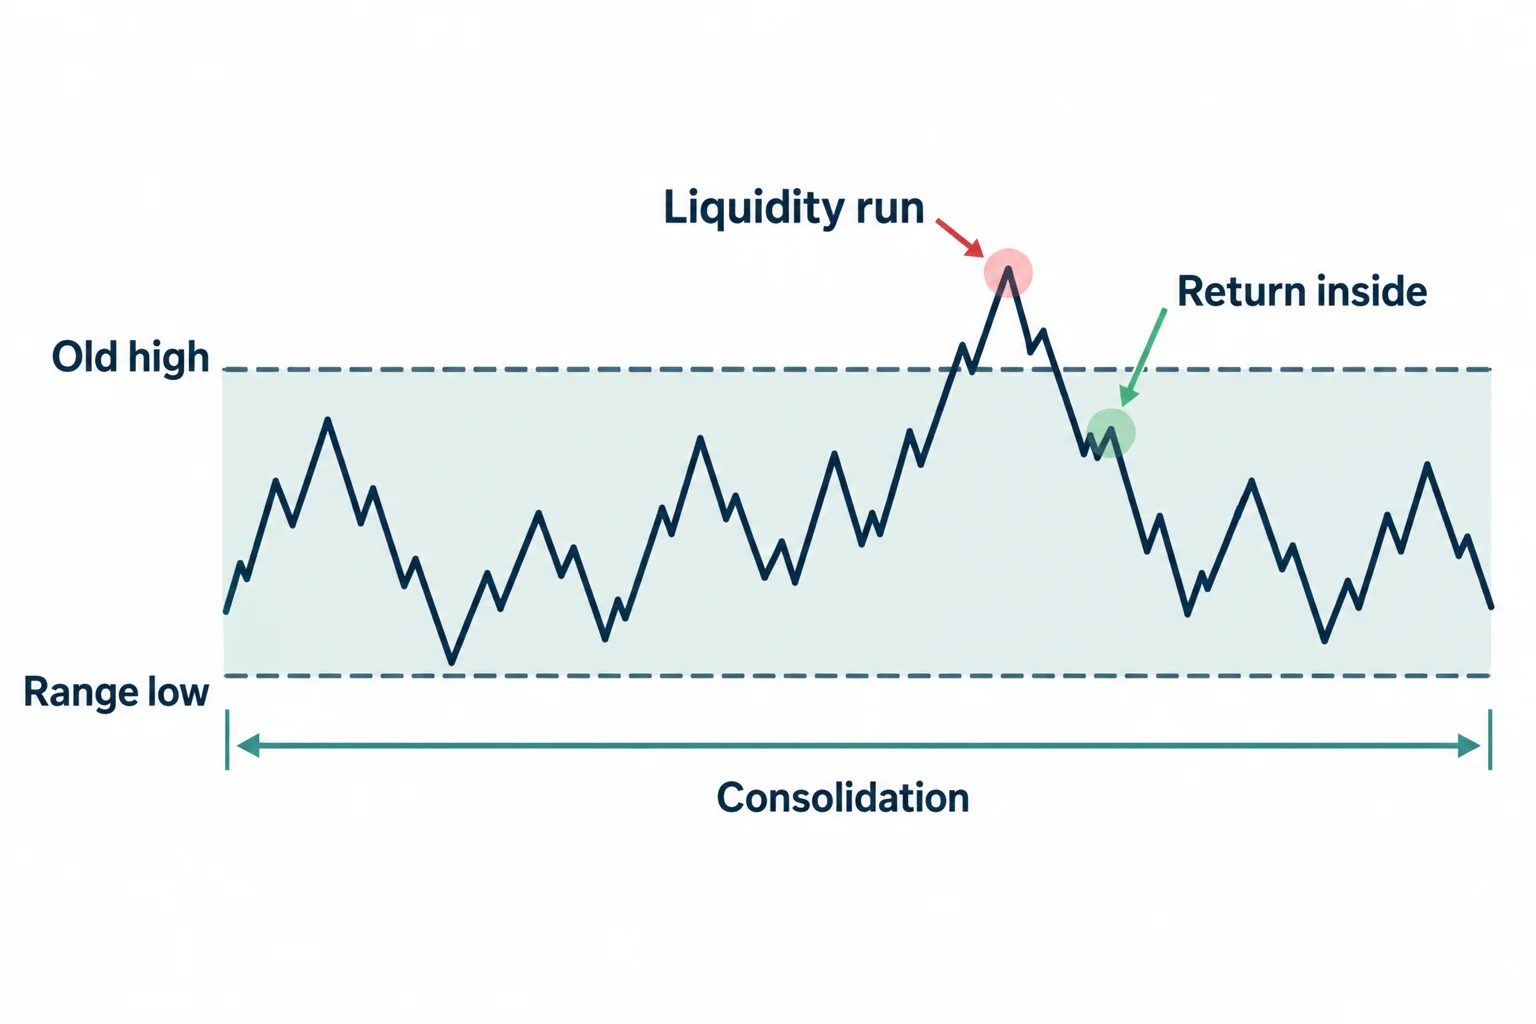
ICT begins with the US Dollar Index daily chart. At 0:40, he describes the index as range-bound and says that this reduced his expectation for a large directional move. Instead of attempting to forecast a decisive breakout, he looked for a shorter move within the existing range.
This distinction drives the rest of the recap. Under ICT’s framework, a consolidation makes a shallow move beyond an old high or low more likely to return inside the range. That is why he treated the GBP/USD move above a prior high as a potential liquidity run rather than automatic evidence of a sustained bullish breakout.
GBPUSD Price Action in the New York Trade Window
At 2:03, ICT connects the setup to what he calls the New York Open Killzone, using an 8:30 a.m. to 11:00 a.m. Eastern time window. He characterizes the day as a “market reversal profile”: GBP/USD had rallied from the London session into New York, formed a high and then began to decline.
His broader point is that a chart pattern should not be considered in isolation. In this example, the proposed narrative included:
- a consolidating Dollar Index;
- GBP/USD rallying during London;
- price reaching above an earlier hourly high;
- a reversal during the New York window; and
- a return toward liquidity below the London low.
ICT repeatedly cautions that an “optimal trade entry” or another isolated formation is not enough by itself. He wants the pattern supported by a session narrative and a broader expectation about whether the market is trending or rotating inside a range.
GBPUSD Liquidity Run and Price Action Shift
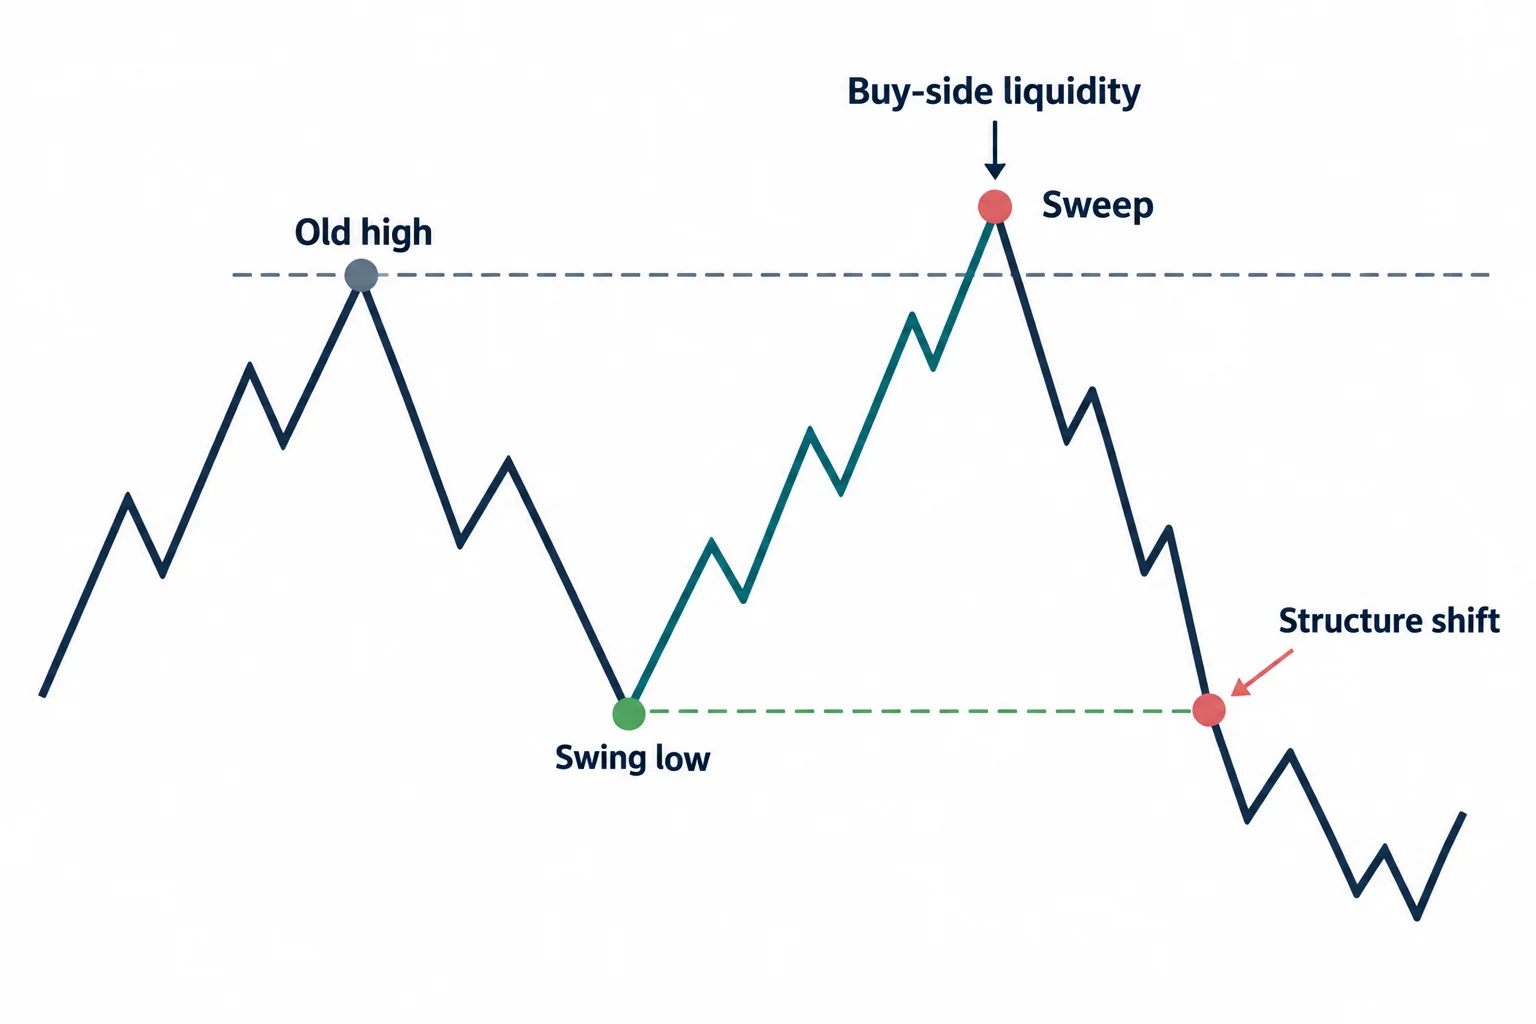
The technical explanation becomes more specific at 24:16. ICT says GBP/USD traded above an old 60-minute high, which he interprets as a run on buy-side liquidity. The automated transcript renders the referenced level as approximately 1.29193, but that number should be checked against the video because the chart itself has not been verified.
ICT then identifies the swing low immediately preceding the push above that old high. At 30:00, he explains that a bearish structure shift requires price to break that particular low. In his terminology, the liquidity event supplies the narrative, while the break below the relevant swing low supplies confirmation that delivery may have shifted lower.
This sequence matters because merely moving above an old high is not, in his account, a short signal. Price could continue rising. He waits for the prior reference point to be reached and then for the associated swing low to fail.
How ICT Defines the Forex Breaker
At 32:05, ICT calls the down-close candle before the run above the previous high a “breaker.” After price breaks the key swing low, he looks for a retracement toward the candle’s low or body as a potential short-entry area.
Later, at 42:03, he also describes a retracement within the high-to-low leg as an optimal trade entry, mentioning the 70.5% retracement and a 1.5 standard-deviation objective. He explicitly says the Fibonacci measurement is not a complete solution; it is one tool used after the directional narrative has been established.
ICT GBPUSD Trade Targets and Management
ICT’s target was the sell-side liquidity beneath the London low rather than an unlimited downside move. He explains at 46:02 that, in a consolidation, he expected price to move only slightly through that low before returning to sideways trade.
Trade management occupies a substantial part of the lecture. Beginning around 8:00, ICT advocates taking partial profits as a way to reduce exposure and make holding the remaining position psychologically easier. Near 54:54, he says he banked 20 pips even though the larger target remained in view. That is the speaker’s account; the transcript alone does not verify an order, fill, account type or net result.
ICT Forex Price Action Lesson Takeaways
- Classify market conditions first: A range-bound backdrop may call for different targets than a trending market.
- Combine price and time: ICT evaluates the structure inside a defined New York-session window rather than treating every occurrence as equivalent.
- Require a sequence: In this lesson, the sequence is an old high being exceeded, followed by a break of the swing low that preceded the run.
- Set targets consistent with the premise: If the thesis is mean reversion within consolidation, expecting an exceptional breakout would conflict with that thesis.
- Separate claims from evidence: ICT makes broad claims about algorithms, central banks and market control, but the transcript does not provide independent evidence for them.
This recap is educational commentary, not investment advice. Historical chart interpretations and a speaker’s reported trade do not demonstrate that the same framework will produce similar results in other sessions.





