
How we researched this article
BestProps used document-based research from primary firm sources, checked September 25, 2026. The complete source list, scope, limitations, and commercial-state record appear near the end of this article.
In ICT Forex Price Action Lesson: GbpUsd London Close Short, uploaded September 3, 2020, ICT reviews a GBP/USD short and then presents what he describes as the live execution and management sequence. His explanation combines the previous day’s range, a bearish order block, a Fibonacci-style retracement area, and relative equal lows.
This is a summary of ICT’s interpretation of the setup, not independent validation of the method or its profitability. The transcript provides ICT’s narration but cannot verify chart prices, broker records, fills, or anything not visible in the source video.
The proposed higher-time-frame context
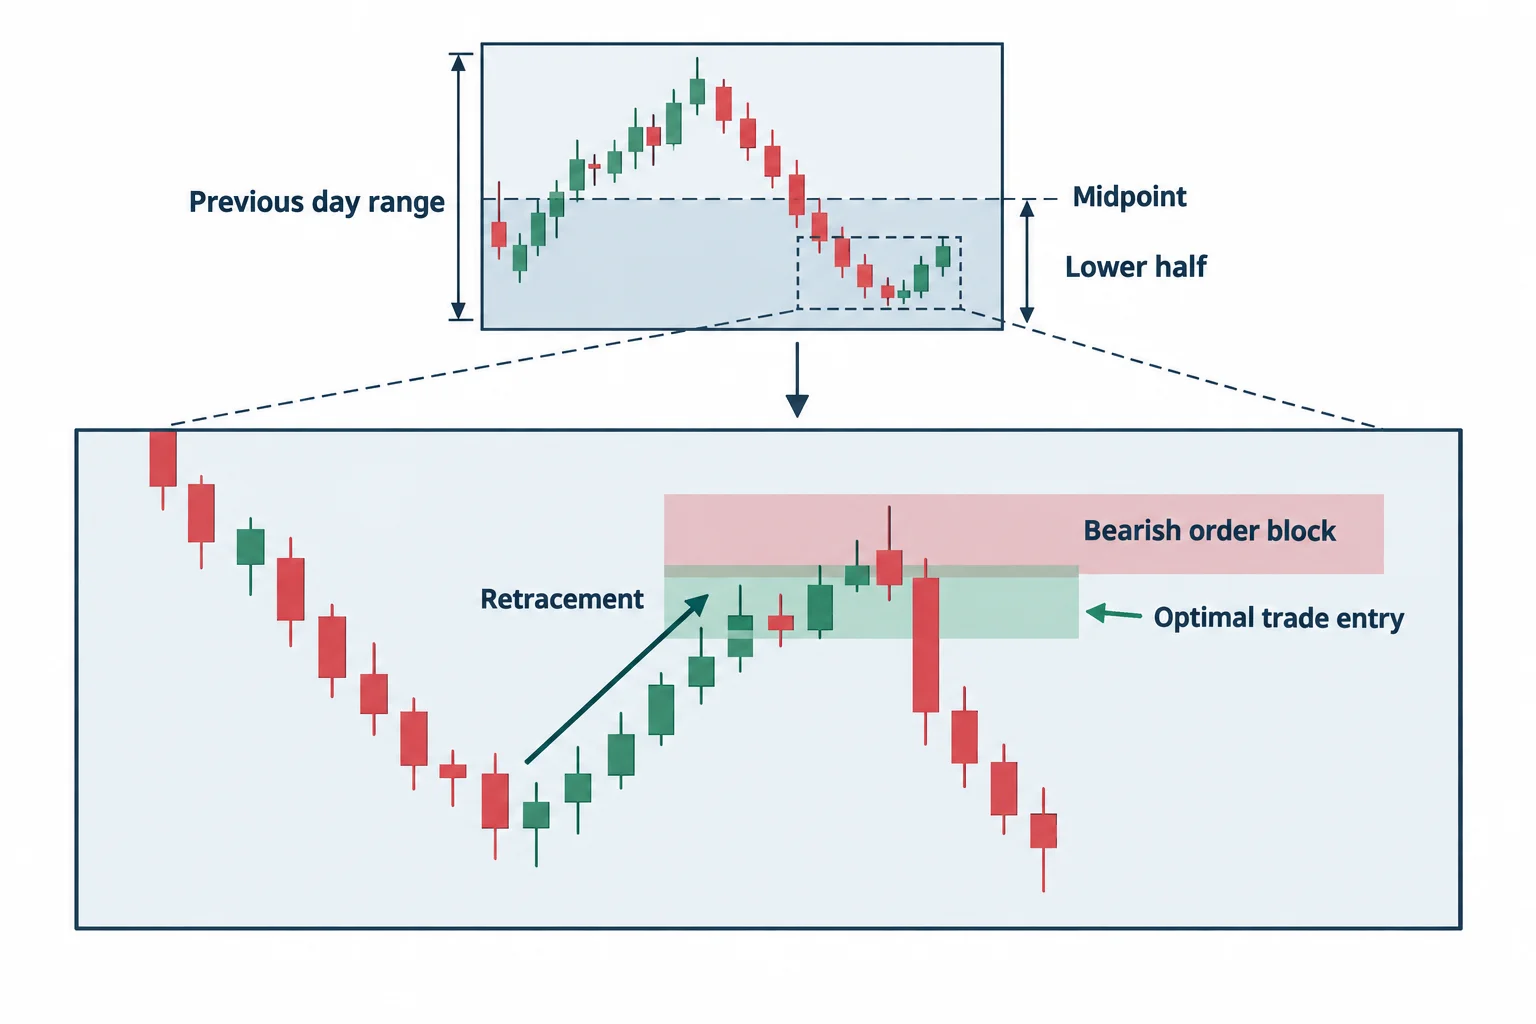
ICT begins by contrasting a chart marked after the fact with an execution record. At 2:27, he introduces the previous day’s range as a central reference. For a bearish setup, he says he expects the relevant opportunity to form within what he calls the lower 50% of that daily range.
He then connects this daily-range idea with two concepts used elsewhere in his teaching:
- A bearish order block, meaning a price area that ICT treats as a possible source of renewed selling.
- An “optimal trade entry” retracement, derived from a prior swing high and low.
Beginning around 3:31, ICT says price traded into the bearish order block, moved down, and then returned to that area. He measures a swing from high to low and identifies a retracement zone as the potential location for a short. The automated transcript renders one level unclearly, so it is safer to understand this as a retracement region rather than rely on every transcribed percentage.
How ICT frames the London close short
ICT divides the September 2 daily high-to-low range at its midpoint and describes a dealing range in which he wants to hunt for shorts. At 4:18, he attributes this behavior to what he calls the “interbank price delivery algorithm,” abbreviated in the transcript as IPTA. That terminology represents ICT’s own market framework; the video does not independently establish the existence or operation of such an algorithm.
He first displays the idea on a five-minute chart and then moves to a one-minute chart to discuss the entry and management in greater detail. According to his narration, the short was taken after price retraced into the identified area and began moving lower. He also shows markers that he says represent entries, partial profit-taking, and the stop-out of the remaining portion.
At 7:14, ICT labels the setup a London close short. He notes that it is not exactly the full New York-session model taught elsewhere on his channel, although he sees overlapping logic between the two.
Target selection and position management
The target in ICT’s analysis is a cluster of relative equal lows. In his terminology, these lows provide a likely destination for price and an area where he wants to realize most of the position. During the narrated execution segment, he says the initial trade had a 15-pip stop and that he planned to close more than 80% if price traded beneath those lows.
His management sequence emphasizes several decisions:
- Watch the character of price movement rather than focus on the displayed profit and loss.
- Reduce the stop as price moves toward the target.
- Prepare a partial close near or just below the relative equal lows.
- Retain only a smaller remainder in case price continues lower.
- Exit the remainder if price reverses into an area that invalidates his reason for staying short.
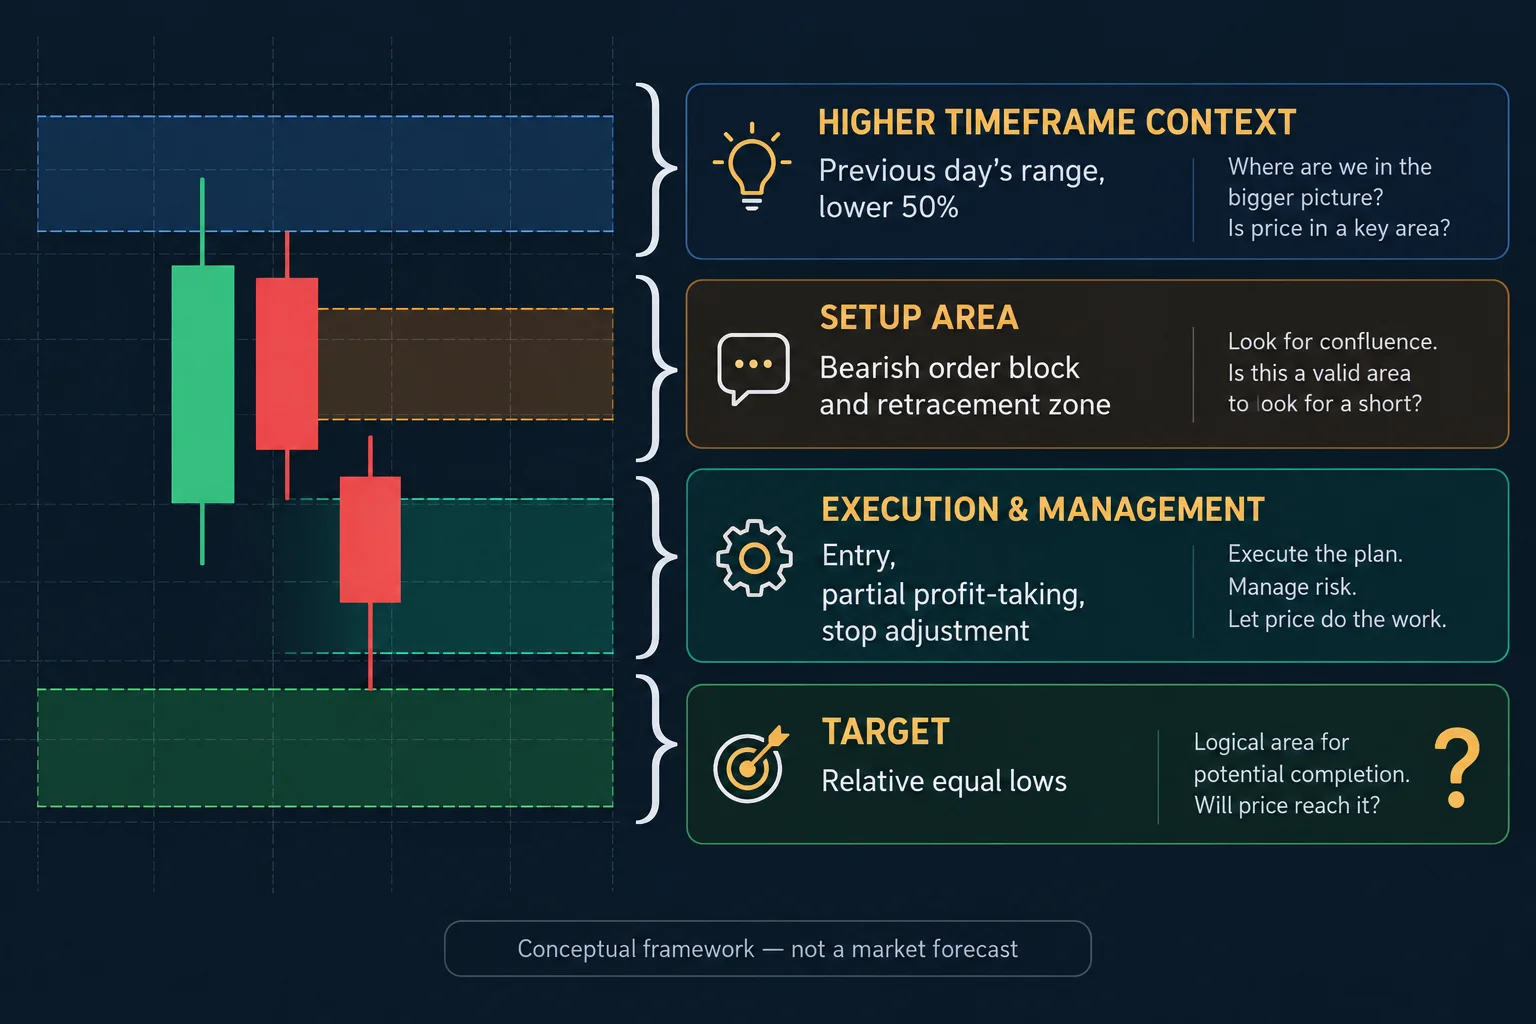
At 8:55, ICT says he lowers the stop after seeing the downside movement he wanted. He also acknowledges that a stop does not guarantee a particular exit because price can gap.
Near 9:15, he describes closing 2.8 million units as price moves below the relative equal lows, leaving a much smaller portion open. He then moves the stop down aggressively. According to the narration, the remaining portion is subsequently stopped out. These are the speaker’s descriptions of the displayed execution; the transcript alone cannot authenticate the account, order records, or exact fills.
General educational interpretation
Separated from ICT’s proprietary terminology, the lesson illustrates a structured trade-review process: establish directional context, identify a retracement area, define a nearby price target, set an invalidation point, and plan partial exits before the market reaches the target. It also shows the difference between the analytical time frame and the execution time frame, with the five-minute chart supplying broader structure and the one-minute chart being used for entry and management detail.
The most transferable point is not that these chart concepts must predict price. It is that the setup, target, stop, and partial-exit plan are described in advance of the shown management sequence. Whether the same framework has a repeatable edge would require evidence beyond this single narrated example.
Primary source and further reading
- The original ICT Forex Price Action Lesson: GbpUsd London Close Short: use the timestamp links in this article to compare the explanation with its source.
- YouTube embedding documentation: platform guidance relevant to the external watch link above.
- 17 CFR 4.41: disclosures concerning hypothetical performance: a regulatory reference, not a statement that a particular recording or this article meets every legal requirement.
Watch the original ICT lesson on YouTube
Watch ICT Forex Price Action Lesson: GbpUsd London Close Short on YouTube ↗
This article is educational commentary on the linked video and is not investment advice or a performance promise.




