
How we researched this article
BestProps used document-based research from primary firm sources, checked September 25, 2026. The complete source list, scope, limitations, and commercial-state record appear near the end of this article.
In “GbpUsd 1.2665 Run”, uploaded December 4, 2018, ICT reviews an eventful GBP/USD session that started with heavy reference activity around 1.2820 on daily and four-hour charts. The recording demonstrates his educational framework for analyzing higher-time-frame context down to one-minute execution, not a recommendation to copy any specific trade.
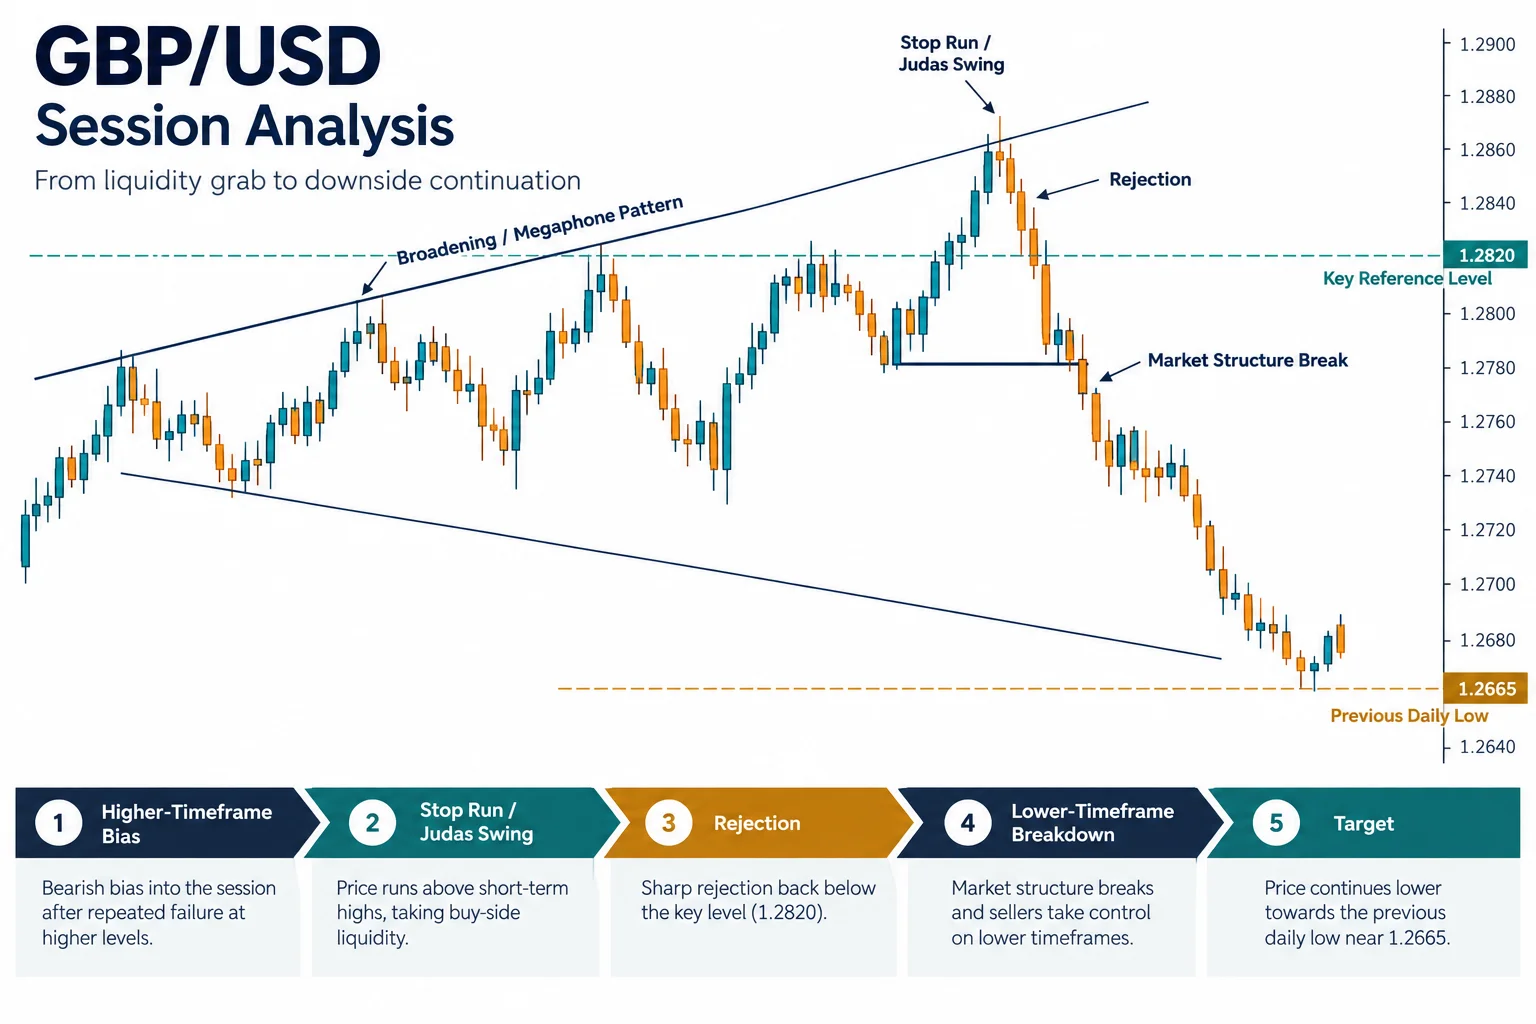
Session reference at 1.2820
Beginning around 0:36, ICT identifies 1.2820 as a level with substantial market activity. He explains that price repeatedly moved above, below and back toward this area, making it a contextual reference rather than strict support or resistance.
ITC describes a London-session run above short-term highs followed by rejection, what he labels a market structure break, a rally toward a bearish order block, and decline toward older daily lows near captioned figures of 1.2663 and 1.2661. The generated captions contain recognition errors, so exact prices are treated as interpretive guidance, not verified fills.
Stop runs and liquidity rejection
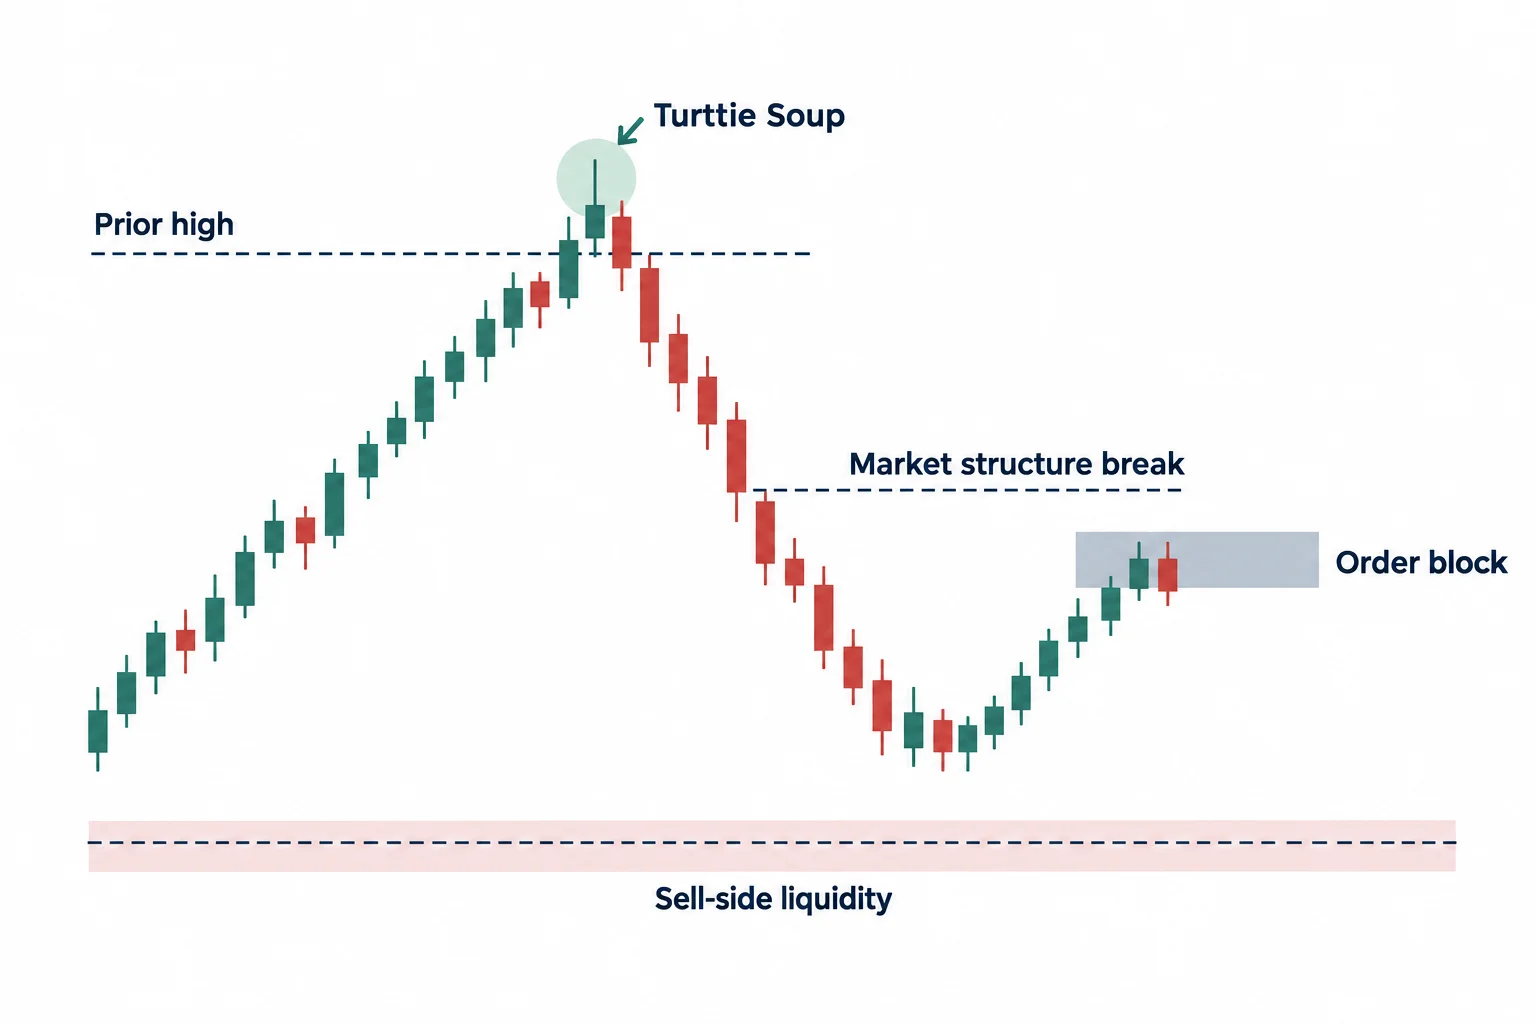
At 6:00, ICT introduces what he calls a Turtle Soup pattern—a stop run beyond a prior reference point followed by reversal. He notes this could function as an exit reference or part of a new setup.
His session walkthrough identifies:
- Price ran above short-term highs during London trading
- The advance failed, producing a market structure break
- A rally returned toward an order block zone
- Price moved toward sell-side liquidity at equal lows and an older chart low
At 10:14, ICT discusses the 15-minute analysis, noting the transcripts report a low near 1.2818 with 1.2815 as a preferred hypothetical entry area. These are chart annotations, not independently verified fills.
Daily bias to one-minute execution
ICT states his broader premise favored a weaker British pound, interpreting early declines as profit-taking rather than a definitive bottom. At 12:20, he shifts to five-minute and one-minute charts, combining a run above the key area, subsequent breakdown, rally into a bearish zone, and alignment with downward momentum using sell-stop orders below market.
The transcript mentions 1.2805, but captions are unclear whether this represents an order, execution or chart reference. ICT also divides the move into smaller intraday ranges seeking repeated short opportunities, noting personal claims about exits on Twitter cannot be verified from this video.
Key educational lessons
The session illustrates ICT’s systematic approach:
- Start with a daily or four-hour reference that price has repeatedly engaged
- Mark prior highs and lows where stop orders concentrate
- Observe whether price runs one side of the range then rejects it
- Use lower-time-frame structure only within higher-time-frame premise context
- Define a target before interpreting every small fluctuation as a new setup
- ICT Breaker Block Trading — Failed Order Block Strategy (Free PDF) — explains failed order blocks and their role in liquidity sweeps.
- ICT HRLR & LRLR — Low & High Resistance Liquidity Runs — covers stop runs and liquidity hunt terminology.
- ICT Breaker Block Strategy: Turn Failed Order Blocks Into High-Probability Trades — Michael Huddleston’s framework for reversal setups.
- ICT Trading: The Complete Guide to the Inner Circle Trader Methodology — comprehensive overview of ICT’s Smart Money Concepts.
ICT concludes near 17:54 by advocating inactivity during non-farm payroll week, demonstrating his risk-management teaching rather than a prediction about specific weekdays.
This video is best understood as ICT’s retrospective chart narrative: 1.2820 provided context, a run above highs supplied the liquidity event, and lower-time-frame rejection guided the proposed path toward daily lows. No fills, profitability or post-session outcomes are established by the transcript.





