
Key takeaways
ICT’s Friday rule replaces the standard Monday Asian Range with the previous Friday’s range—measured from Thursday 7:00 PM through midnight New York time. The Friday range forms the reference window for Monday’s session. The video walks through the definition, the time-window mechanics, and a live Nasdaq example where price revisited the Friday low before continuing higher.
How we researched this article
BestProps used document-based research from primary firm sources, checked September 25, 2026. The complete source list, scope, limitations, and commercial-state record appear near the end of this article.
Why Friday Replaces Monday
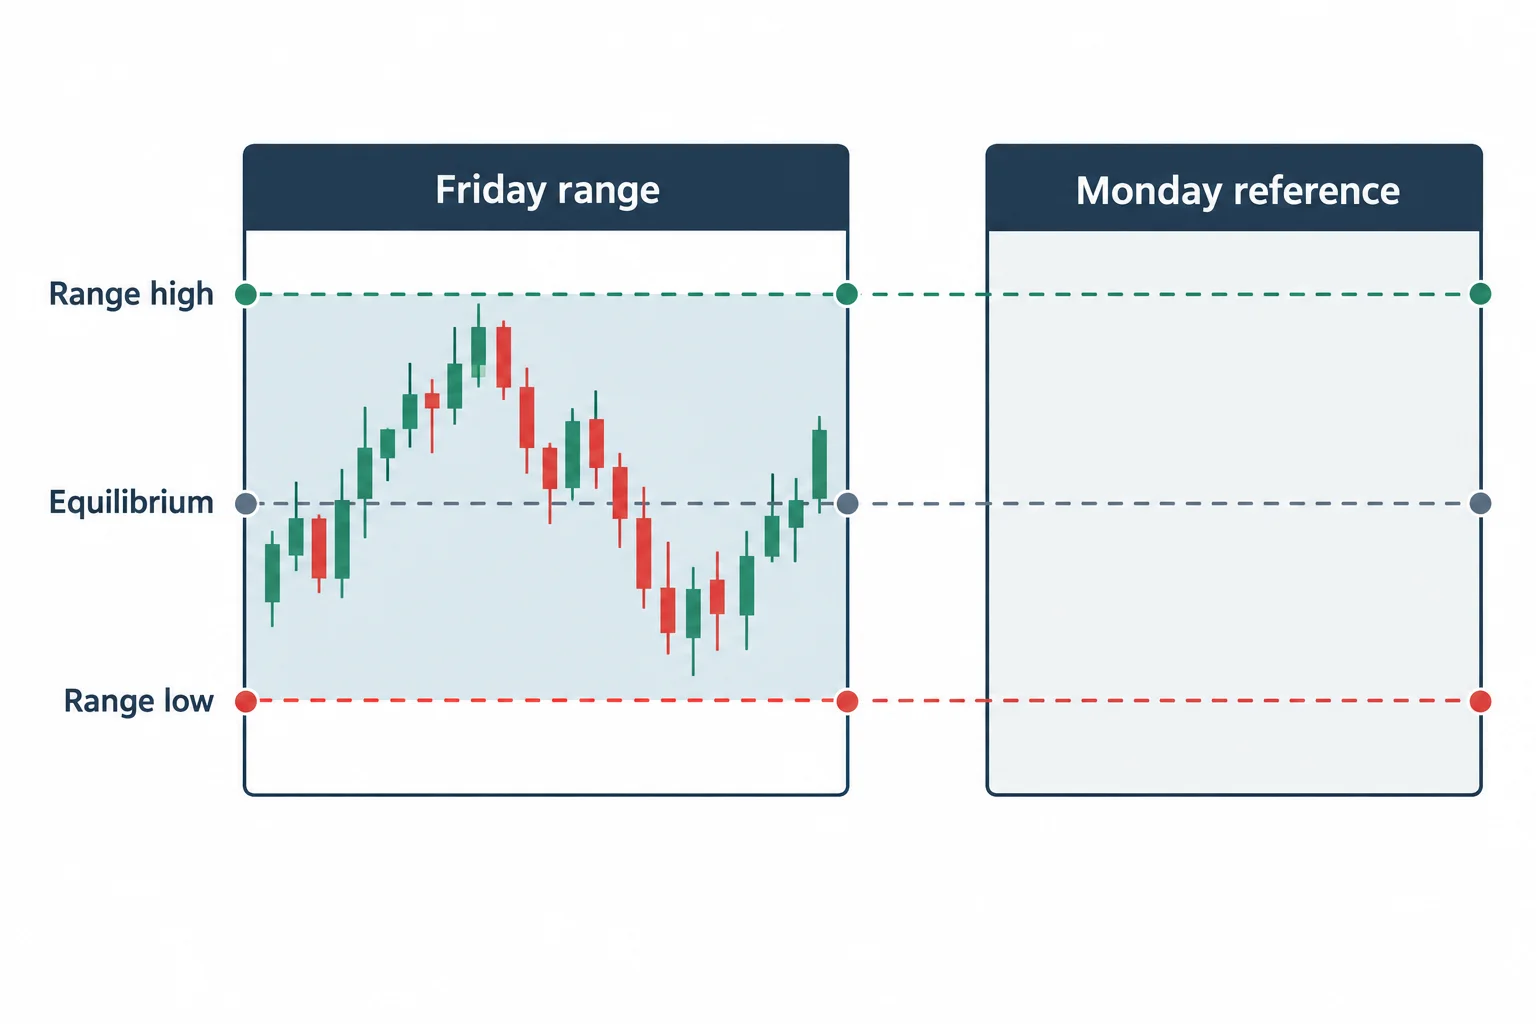
The Inner Circle Trader (ICT) methodology defines the Asian Range as the high-to-low span printed during the Asian session. For Monday, however, ICT substitutes the prior Friday’s 7:00 PM–midnight NY window because Sunday’s open is thin and Monday’s true Asian session hasn’t produced a usable range yet. The Friday range therefore becomes Monday’s reference for directional bias, equilibrium, and liquidity draws.
Defining the Friday Asian Range Window
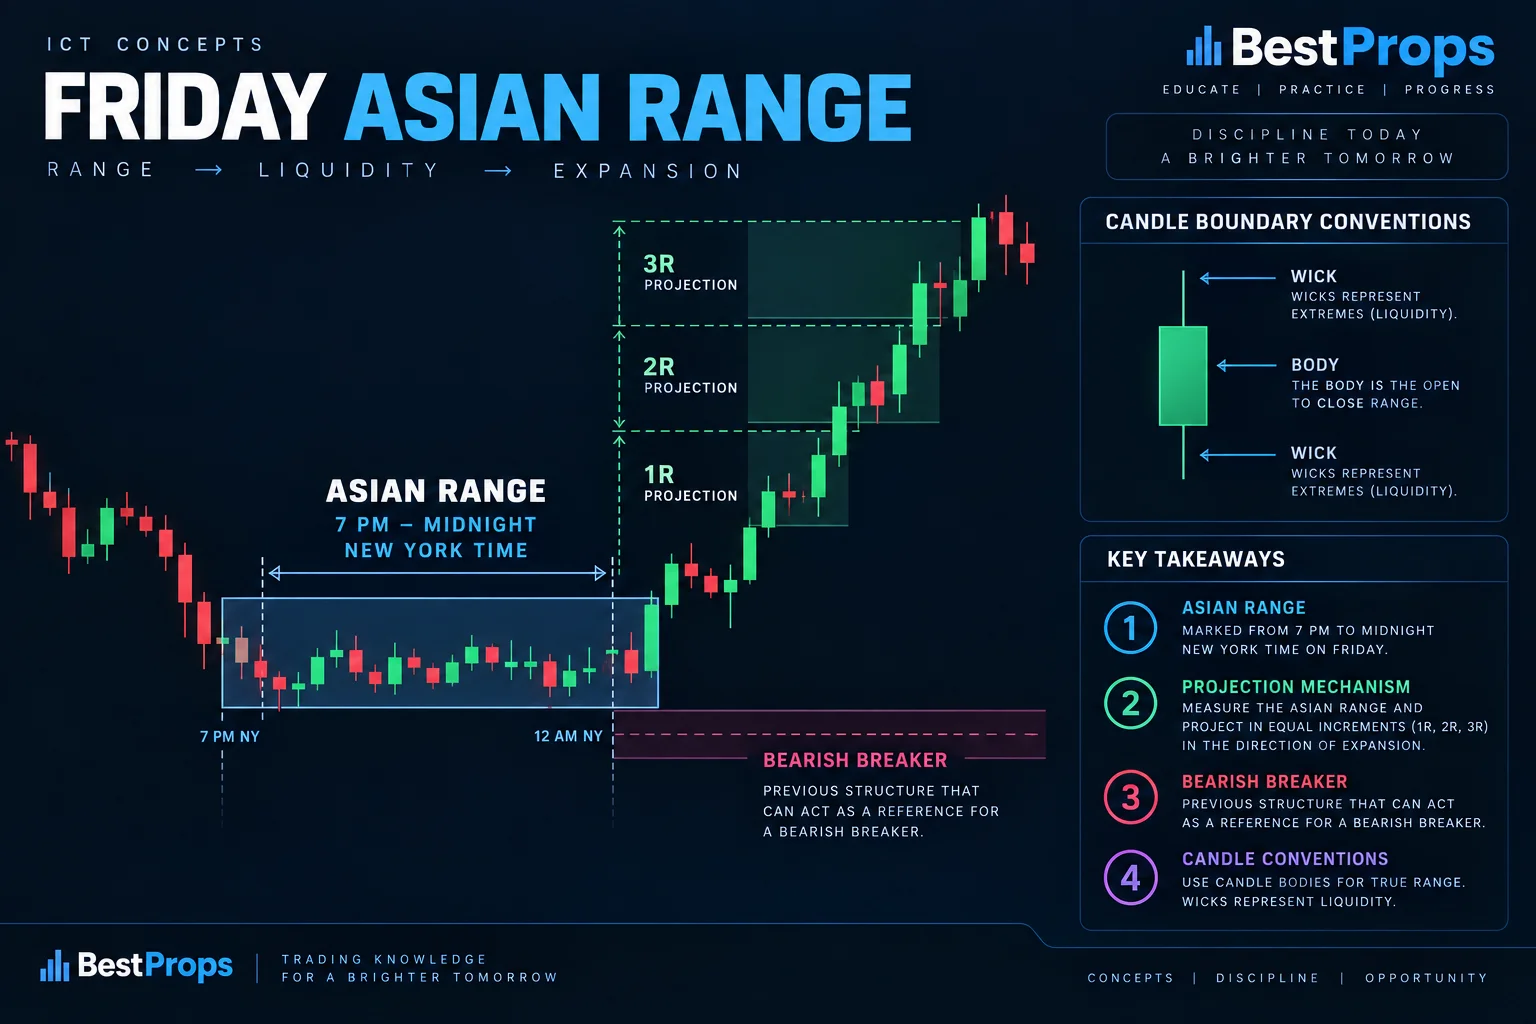
Time window: Thursday 7:00 PM → midnight New York time (which is Friday 00:00–05:00 UTC depending on DST). Measure: Highest high to lowest low printed in that window. Application: Those two levels—Friday Asian Range High and Friday Asian Range Low—are carried forward as Monday’s Asian Range High and Low.
Live Example: Nasdaq (NQ) Walk-Through
The video (ICT Friday Asian Range lecture) reviews a Nasdaq futures chart where:
- Friday’s 7 PM–midnight range printed a clear high and low.
- On Monday, price opened, traded down to retest the Friday low (acting as support), then rallied toward the Friday high.
- The presenter notes the retest as a “liquidity draw” on the Friday low before continuation—consistent with the ICT concept of price seeking the opposite side of the defined range.
Timestamp references from the video:
- 1:18 — Definition of the Friday Asian Range window
- 2:25 — Marking the Friday high/low on the chart
- 3:52 — Monday session walk-through: retest of Friday low
- 5:10 — Continuation toward Friday high and session wrap-up
How to Apply This in Your Prep
- On Thursday evening, mark the 7:00 PM–midnight NY high and low for the instrument you trade.
- Carry those two levels into Monday as your Asian Range High/Low.
- Watch for Monday price to probe one side of the range (often the low first) before rotating to the other side.
- Treat the Friday range as a reference framework, not a standalone signal—combine with ICT market structure, order blocks, and session opens.
Watch the Full Lecture
Resources
- Inner Circle Trader (ICT) YouTube Channel — Primary source for ICT methodology lectures.
- CME Group Nasdaq-100 Futures (NQ) Contract Specs — Official exchange specifications for the instrument used in the example.
- Investopedia: Asian Session Definition — General reference for the Asian trading session hours and characteristics.
- BabyPips: Forex Trading Sessions — Session-overlap cheat sheet including NY/Asian transitions.
Disclaimer: This article summarizes a publicly available educational video. It does not constitute trade advice, nor does it verify the profitability of any setup shown. Chart outcomes described are the presenter’s reported observations; past performance does not guarantee future results.




