
Key takeaways
ICT’s EUR/USD scalping lesson presents a historical chart-study protocol for bearish OTE pullbacks, not verified evidence of profitability.
Read the full summary
ICT’s EUR/USD scalping lesson presents a historical chart-study protocol for bearish OTE pullbacks, not verified evidence of profitability. Viewers inspect only the preselected blue-shaded downswing on five-minute or 15-minute charts, draw each intraday high-to-low retracement, model a short entry at 62%, place a hypothetical stop five pips above the prior swing high, and record setup count, maximum adverse movement, favorable pips, duration, failed cases, and ambiguous cases. Although ICT identifies 62%, 70.5%, and 79% as OTE levels, the assignment standardizes entry at 62% and limits observations to the London kill zone from two a.m. through five a.m. and the New York kill zone from eight thirty a.m. through eleven a.m., both in New York local time. Positions must close before five a.m. for London or by eleven a.m. for New York, while Asian-session setups and signals between the two windows are excluded. Reproduction requires verifying the chart platform time zone and daylight-saving treatment, and the unavailable chart dates and prices mean the transcript alone cannot establish the exact sample or future performance.
How we researched this article
BestProps used document-based research from primary firm sources, checked September 25, 2026. The complete source list, scope, limitations, and commercial-state record appear near the end of this article.
In ICT Forex Interactive Learning Experience – Scalping OTE Setups, ICT presents a tightly constrained backtesting assignment for studying bearish intraday setups in EUR/USD. Rather than asking viewers to forecast an entire daily candle, he narrows the exercise to historical pullbacks within a preselected bearish price swing.
The lesson is best understood as a chart-study protocol, not evidence that the pattern is profitable. ICT selects the market context, historical range, direction, sessions, entry convention and exit deadline in advance. The transcript does not show enough chart detail to independently recover the dates or prices in the shaded study area, and it provides no verified trading results.
ICT Forex Daily Range Study
ICT begins with his interpretation of daily-range structure. At 1:38, he describes a hypothetical bullish day as one that opens toward the lower portion of its range, makes its low relatively early, expands upward and closes near its high. He says the bearish model reverses that sequence.
The assignment concentrates only on bearish days and short-side setups. Its purpose is not to predict the exact daily low or close. Instead, viewers are asked to study the middle of a move after a directional framework has already been imposed. This is an important limitation: it is a hindsight exercise built around a range that ICT chose for teaching purposes.
How ICT Frames the Forex OTE Study
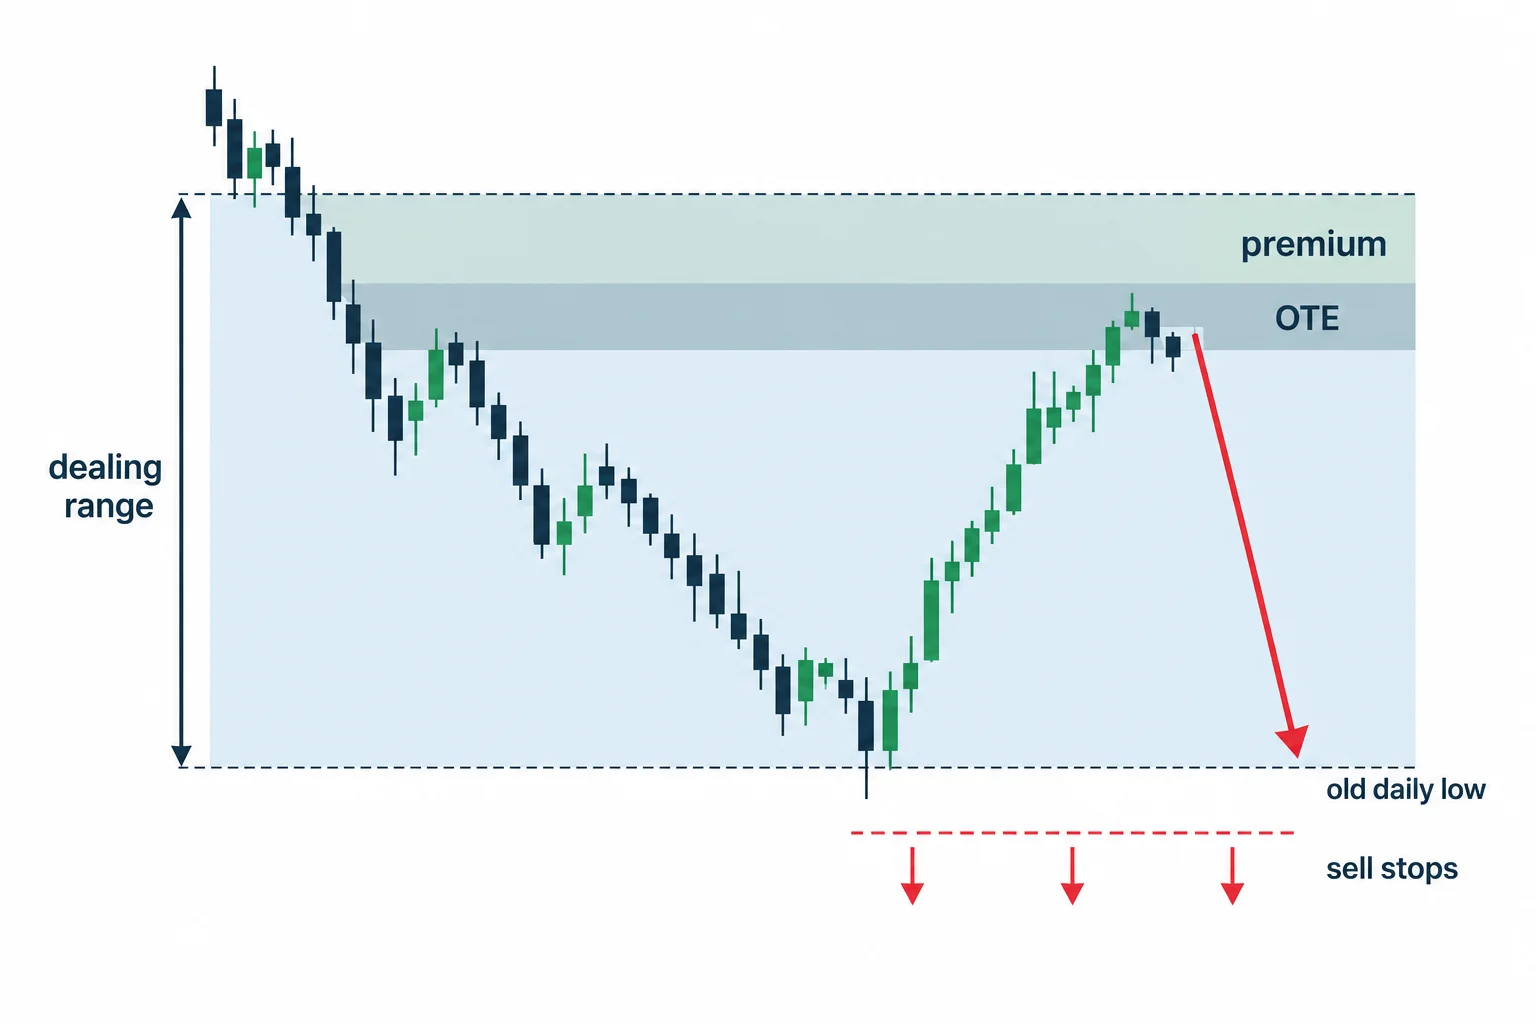
At 5:08, ICT identifies EUR/USD as the sole pair for the assignment. On the daily chart, he draws what he calls a dealing range from a selected high to a selected low. Applying a Fibonacci retracement to that range produces the levels he associates with an “optimal trade entry,” or OTE: 62%, 70.5% and 79%.
In ICT’s terminology, the upper part of this bearish dealing range is a premium area from which a downward swing might originate. He then frames the old daily low (and slightly below it) as the destination of interest, describing resting sell stops beneath that low. These are ICT’s market interpretations, not facts established by the transcript.
The chart’s blue shaded area defines the only historical segment viewers are meant to inspect. At 9:12, ICT instructs viewers to move from the daily and hourly context to 15-minute and five-minute charts. Every qualifying pullback inside that selected downswing is to be reviewed, but only during the designated London and New York windows.
Forex Scalping Session Windows
ICT gives both windows in New York local time:
- London window: 2:00 a.m. through 5:00 a.m.
- New York window: 8:30 a.m. through 11:00 a.m.
These parameters appear at 10:58. ICT calls them “kill zones.” He excludes the Asian session and any setups occurring between the two windows. His surrounding explanation of March 2021 time-zone alignment is potentially confusing, so anyone reproducing the historical study would need to verify the chart platform’s time zone and daylight-saving treatment rather than relying on an assumed UTC offset.
ICT Scalping Setup Entry and Exit Rules
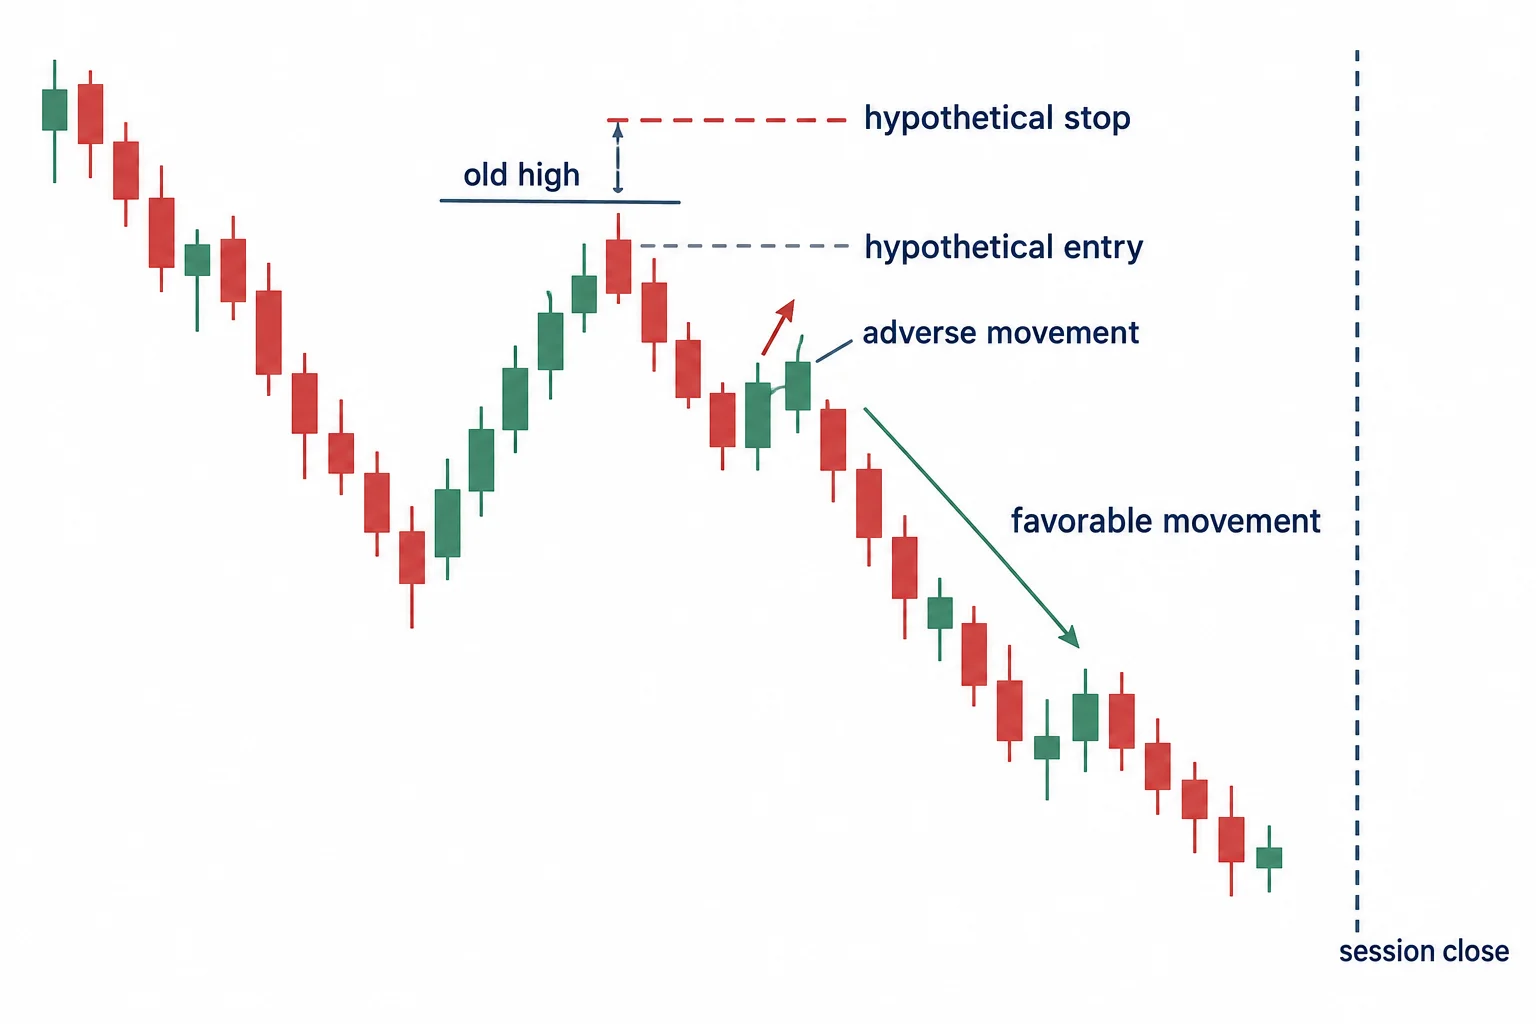
Although ICT mentions three OTE levels, this assignment standardizes the hypothetical entry at the 62% retracement. At 13:11, he asks viewers to inspect each historical swing and record both favorable movement and adverse movement.
For each bearish pullback, the stated process is:
- Identify a relevant high-to-low intraday swing inside the selected bearish study area.
- Draw the retracement from that swing’s high to its low.
- Use the 62% retracement as the hypothetical short entry.
- Place the hypothetical stop five pips above the old high from which the retracement was drawn.
- Measure the highest price reached after entry and before a favorable decline to calculate drawdown in pips.
- Record the favorable movement available before the applicable session window closes.
The stop and measurement rules are explained at 14:04. ICT also requires each hypothetical position to be closed by the end of its study window: before 5:00 a.m. for London or by 11:00 a.m. for New York. That rule prevents the exercise from crediting a setup with price movement that occurred much later.
Why Failed OTE Setups Matter in the Study
One of the lesson’s most useful general principles is its warning against hindsight selection. Around 11:54, ICT tells viewers to include setups that would have failed rather than recording only attractive examples. He recommends tracking how long each setup took, how far it moved against the hypothetical entry and how many pips it offered before the session deadline.
This can be generalized into a sound educational habit: define classification and measurement rules before reviewing the sample, then preserve unfavorable observations. It does not validate OTE or ICT’s “institutional order flow” explanation, but it makes the resulting notes less vulnerable to cherry-picking.
ICT Forex Scalping Study Checklist
ICT summarizes the assignment at 15:32:
- Study only EUR/USD within the chart’s blue shaded historical area.
- Use five-minute and/or 15-minute charts.
- Consider bearish OTE pullbacks only.
- Restrict observations to the specified London and New York windows.
- Model entry at 62% and a stop five pips above the swing high.
- Record setup count, drawdown and favorable pips before the session cutoff.
- Include failed and ambiguous-looking cases rather than retaining winners alone.
The video therefore supplies a structured worksheet more than a complete trading system. The unseen chart is essential for identifying the exact sample, while the transcript supplies the study rules. Any result would remain historical and hypothetical; it would not establish future performance or constitute investment advice.





