
Key takeaways
ICT Forex Scalping Interactive Study, uploaded March 27, 2021, reviews six days of EUR/USD charts using a bearish higher-time-frame premise, London and New York session timing, old daily lows as liquidity objectives, and 62%, 70.5%, and 79% optimal-trade-entry retracements on five- or 15-minute charts.
Read the full summary
ICT Forex Scalping Interactive Study, uploaded March 27, 2021, reviews six days of EUR/USD charts using a bearish higher-time-frame premise, London and New York session timing, old daily lows as liquidity objectives, and 62%, 70.5%, and 79% optimal-trade-entry retracements on five- or 15-minute charts. The example model shorts near 62%, places a hypothetical stop five pips above an old high, targets one pip below an old low, and uses an 11 a.m. cutoff unless price has broken the key daily low and is accelerating. After the first target, traders may take off a substantial portion and retain a smaller position for a Fibonacci-extension or round-number objective, with one London example requiring exit before 5 a.m. ICT emphasizes that bearish context can include up-close days, invalid or losing setups should be recorded, and traders should take no trade when the required pattern does not form. The charts lack disclosed dates, complete price scales, verified executions, performance records, and independent testing, so the lesson is a discretionary educational framework rather than evidence of profitability or a mechanical trading system.
How we researched this article
BestProps used document-based research from primary firm sources, checked September 25, 2026. The complete source list, scope, limitations, and commercial-state record appear near the end of this article.
In ICT Forex Scalping Interactive Study, uploaded on March 27, 2021, ICT reviews a six-day EUR/USD study built around a bearish higher-time-frame interpretation. The lesson is less about taking a trade every day than about connecting daily context, session timing, retracements and old highs or lows.
The examples depend heavily on charts shown in the video. Because captions do not disclose the chart dates, complete price scale or actual executions, this article explains the stated framework without treating the examples as verified fills or evidence of profitability.
ICT Forex Scalping Daily Range Study
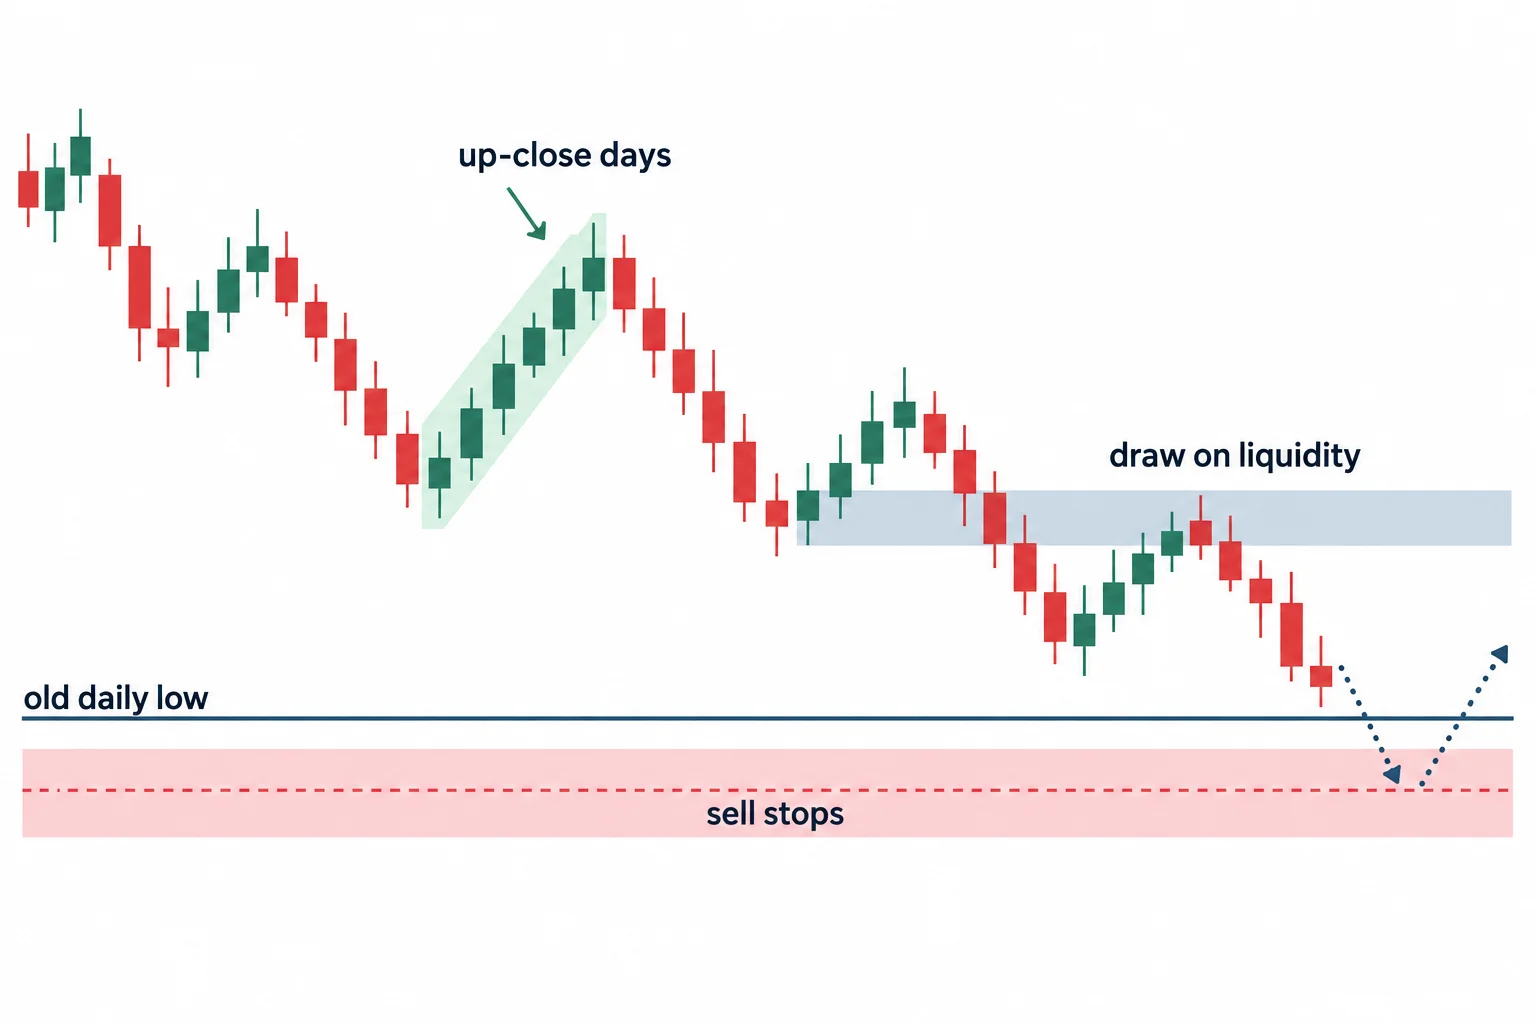
ICT begins by revisiting the daily range (open, high, low and close) and concepts he calls a “draw on liquidity” and institutional order flow. In the illustrated bearish scenario, he expects price eventually to move toward sell stops beneath an old daily low. He then asks viewers to inspect the London and New York sessions on five- or 15-minute charts for possible entries (0:26).
His retracement framework uses levels described as 62%, 70.5% and 79%. These belong to ICT’s “optimal trade entry” terminology; the transcript does not provide independent testing showing that these levels predict market direction.
A central point follows: even if the daily interpretation is bearish, every candle need not close lower. ICT says a move toward an old low may unfold across multiple sessions and include one or more up-close days. Traders following this model should therefore be prepared to wait rather than treating every day as a short-selling opportunity (2:00).
ICT Forex Scalping for Intraday Trades
For the first example, ICT identifies London and New York highs, measures a high-to-low retracement and discusses a short near the 62% retracement. The model described in the lesson places a hypothetical protective stop five pips above an old high and a profit-taking order one pip below an old low. It also imposes an 11:00 cutoff unless price has broken the important daily low and is accelerating toward the larger objective (3:30).
ICT characterizes this as a small, logically bounded scalp rather than an attempt to capture an exceptional move. He argues that alignment with higher-time-frame order flow and session timing can improve selectivity, although the transcript supplies no performance records or comparative testing for that claim.
Managing an ICT Scalp After the First Target
In a later London-session example, the old low serves as the initial objective. Once that low is broken while session time remains, ICT discusses taking a substantial portion off and optionally retaining a smaller position for another objective. He mentions Fibonacci extensions and round-number measurements as possible ways to frame that extension, while emphasizing an exit before 5:00 a.m. in the example (5:17).
The educational distinction is important: the transcript presents a chart review and discretionary model, not a mechanical rule guaranteeing that price will reach either objective. It also does not establish whether any example represents a live trade.
When ICT Forex Scalping Signals No Trade
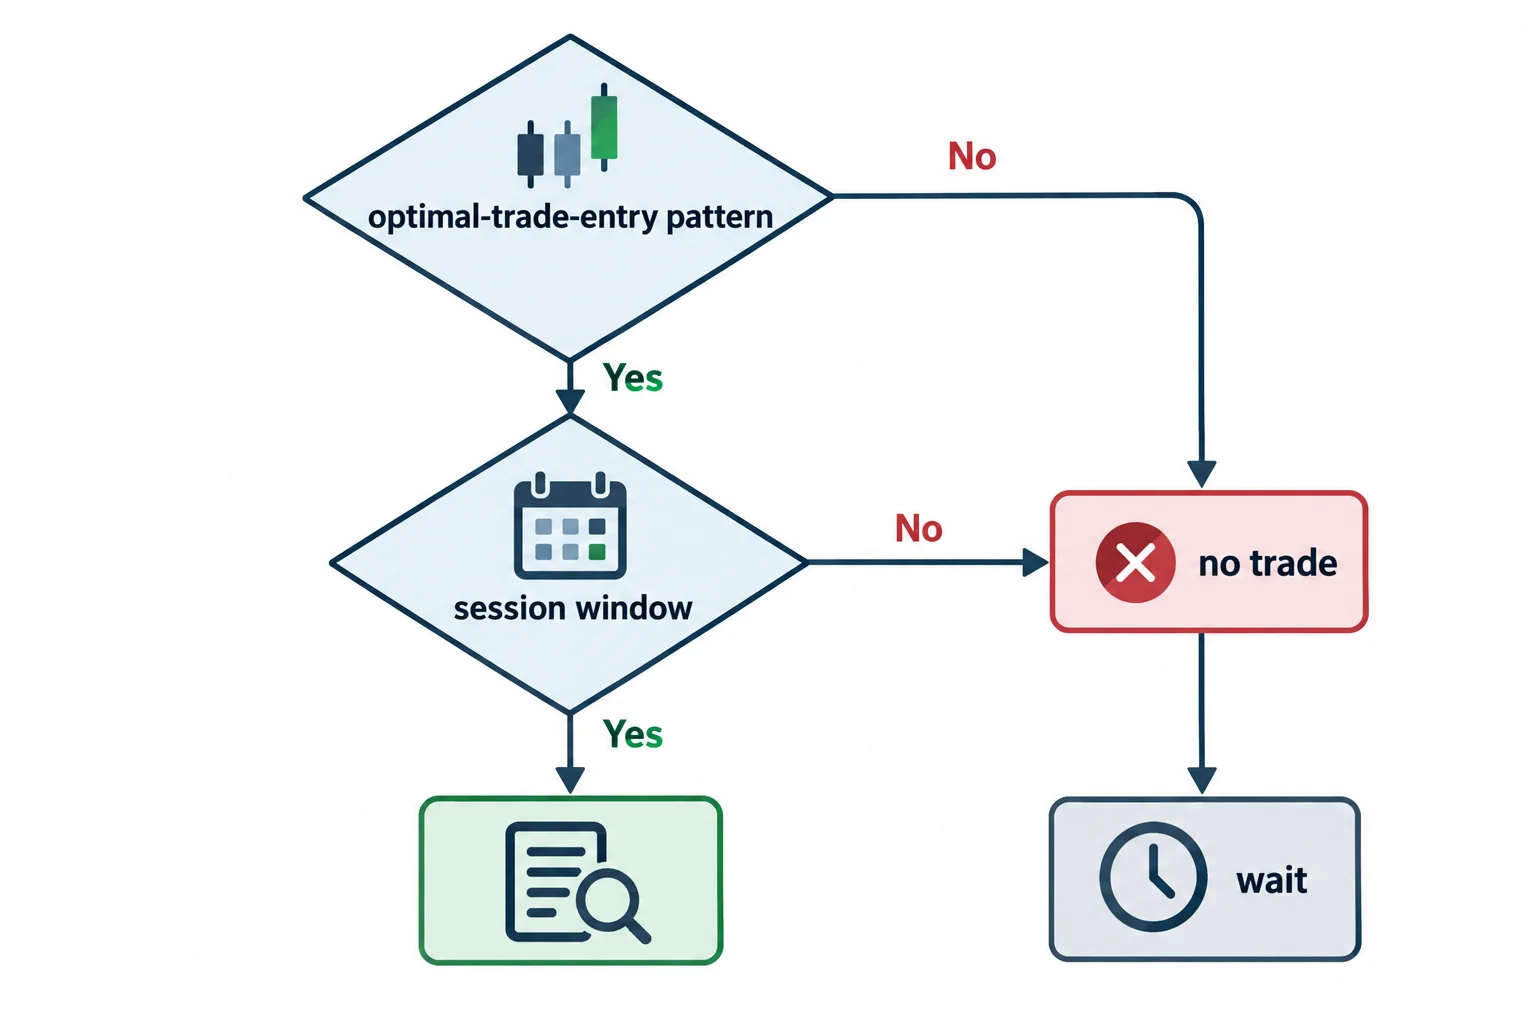
One of the clearest lessons appears on an up-close day. ICT says the price action rises aggressively from the lows and offers no suitable London or New York optimal-trade-entry pattern. His prescribed response is to “sit on your hands and wait” (6:50).
The next reviewed day is also rejected. ICT notes that a viewer might interpret one movement as an entry, but he would either exclude it under his rules or count that interpretation as a possible loss rather than making every historical example appear perfect. By 11:00, the setup has not formed within the designated window (7:55).
This is arguably the most transferable study habit in the session: write down conditions that invalidate a trade, not only conditions that appear to support one. Doing so makes a retrospective chart review less vulnerable to selecting only attractive examples.
ICT Forex Liquidity Near the Old Daily Low
In the final illustrated setup, ICT selects what he considers a cleaner swing and retracement during New York trading. As price breaks lower near the previously marked daily low, he interprets the proximity to that liquidity objective as a reason to anticipate faster movement. He says price attacks the old daily low and trades beneath it on the following day (8:43).
That sequence is ICT’s reading of the displayed chart. The captions alone cannot verify precise prices, orders, fills or how much of the move could have been captured.
ICT Forex Scalping Interactive Study Checklist
ICT closes by summarizing the components of the model (9:37). Recast as a chart-study checklist, they are:
- Define when the trading window begins and ends.
- State the higher-time-frame directional premise and the old high or low being monitored.
- Specify the retracement and session filters required before considering an entry.
- Use a consistent method for limiting risk rather than changing it impulsively.
- Identify old lows as potential objectives for shorts and old highs as potential objectives for longs.
- Record why a day produced no valid setup.
- Expect counter-directional daily closes even within a broader directional thesis.
ICT Forex Scalping Study for Education Only
Separate from ICT’s market claims, the video demonstrates a useful process for building a falsifiable study routine: establish context, limit observation to defined sessions, write down entry and exit conditions, and preserve no-trade and losing examples. Historical chart observations can then be logged consistently rather than reconstructed after the outcome is visible.
ICT finishes by encouraging viewers to turn selected concepts into their own trading plan (11:21). Any such model would still require independent testing, realistic cost assumptions and risk controls. This summary is educational and is not investment advice or a promise of trading performance.




