
How we researched this article
BestProps used document-based research from primary firm sources, checked September 25, 2026. The complete source list, scope, limitations, and commercial-state record appear near the end of this article.
In ICT Forex OTE Example: EurUsd, uploaded on August 10, 2020, ICT walks through what he identifies as a bearish Optimal Trade Entry (OTE) on a 15-minute EUR/USD chart. His explanation connects price structure, a bearish order block, session timing and the prior Friday’s low.
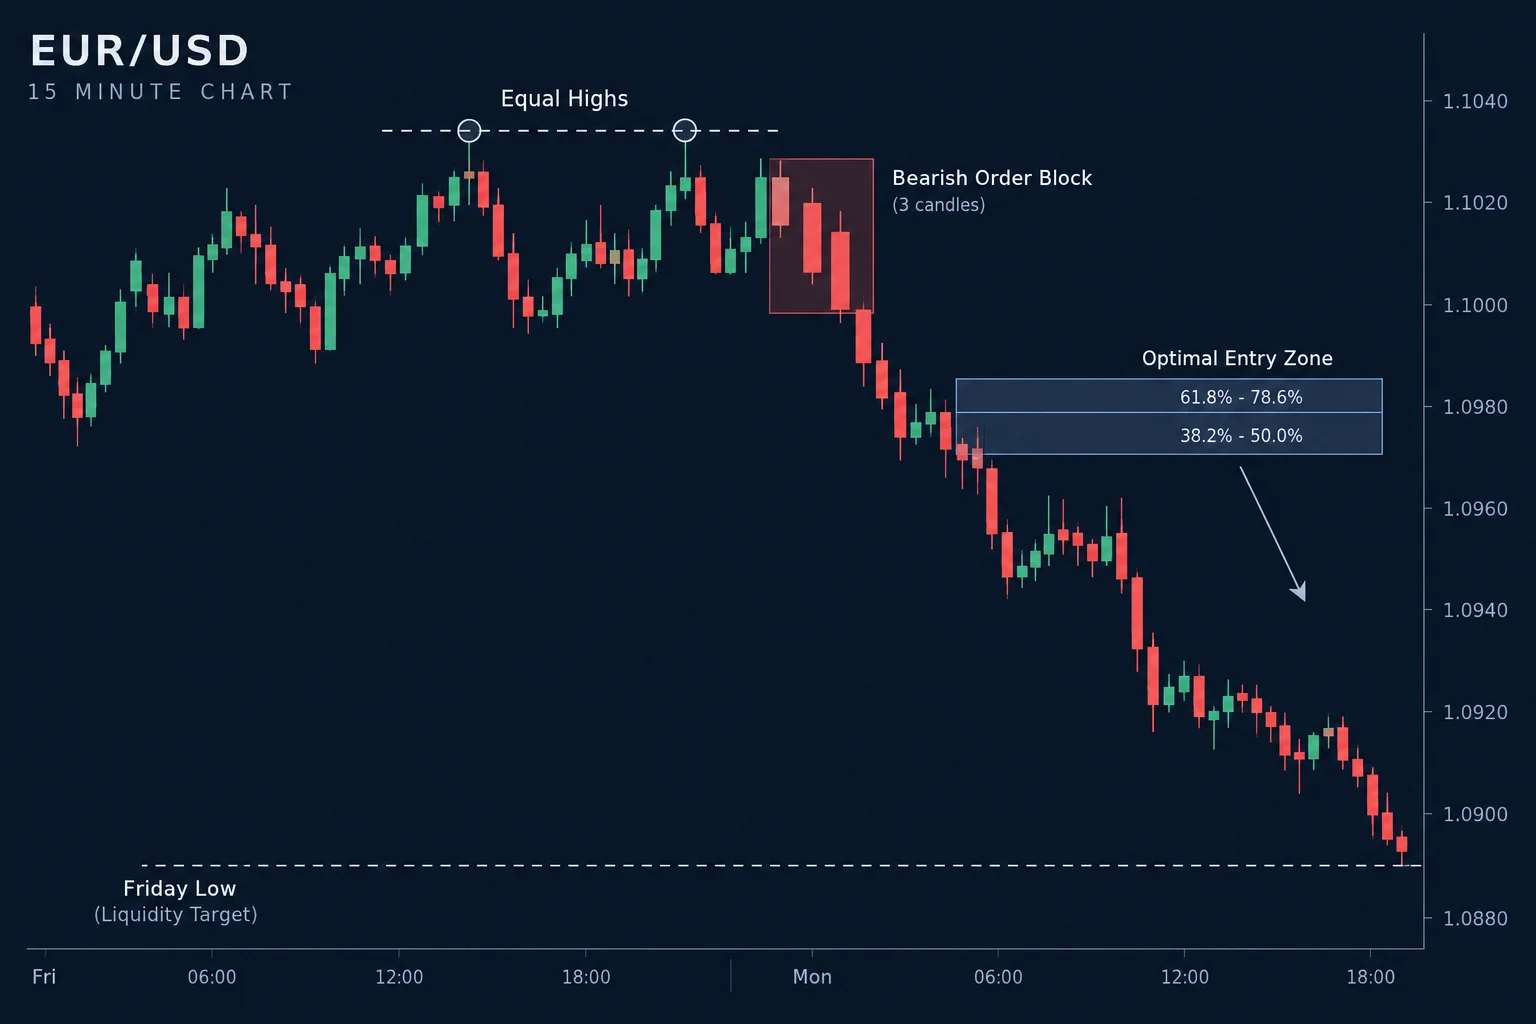
The recording is a concise chart lesson rather than a complete trading-system presentation. Because the source is an automatically transcribed video of the original audio and the chart itself was not available for independent inspection here, exact price levels, candle times, executions and the ultimate trade result cannot be independently established from the spoken commentary alone.
ICT Forex OTE Structure on EURUSD
After a brief channel update, ICT begins the chart discussion at 1:07. He describes a breakdown, equal highs and price movement around the New York open. Price then returns to a three-candle area that he classifies as both a bearish ICT order block and part of an OTE setup.
At 1:31, he specifically tells viewers to pay attention to the candle bodies. In his interpretation, the three candles should be treated together as one bearish order block. He then narrates price breaking lower, retracing into the area and expanding down again.
The key downside reference is the previous Friday’s low. ICT says the move is reaching toward that level, treating it as a potential liquidity objective rather than choosing an arbitrary target.
Why Friday’s Low Matters in the ICT OTE Example
ICT marks the prior Friday’s low at approximately 2:19. He describes the London-open movement as briefly piercing that low before discussing subsequent movement into the New York session.
Within ICT’s framework, old highs and lows can remain relevant because traders may cluster orders around visually obvious extremes. His teaching in this example can be summarized as follows:
- Establish a directional idea from the observed price structure.
- Use a prior daily or weekly-session extreme as a possible liquidity objective.
- Consider the time of day, particularly London and New York session activity.
- Wait for a retracement into the area ICT defines as an OTE and bearish order block.
- Assess the idea in relation to the identified target rather than viewing the retracement in isolation.
At 2:41, ICT also mentions a smaller OTE that could be examined on a five-minute chart. He associates it with a run on relative equal highs, followed by an expansion upward and a retracement configuration intended to frame a possible short toward Friday’s low.
ICT OTE Retracement and Bearish Order Block
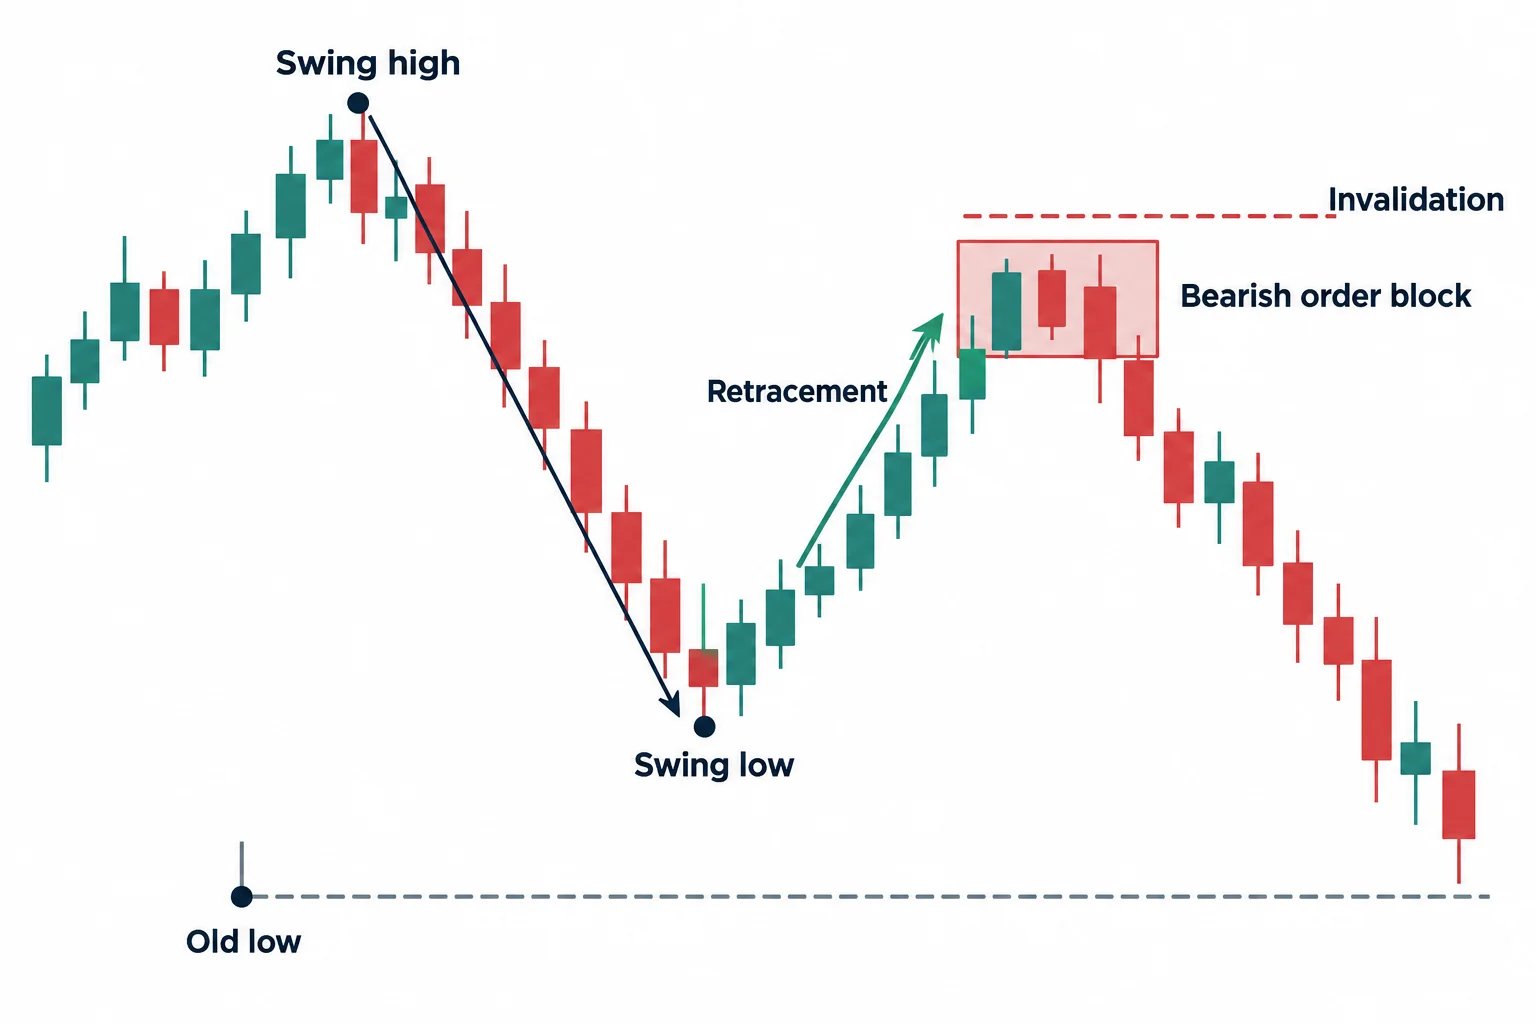
Around 2:53, ICT discusses measuring from a high to a low during the New York session. The automated transcript renders one retracement reference as “2%,” which is unclear and should be checked against the chart and original audio. He also refers to a 79% retracement level and uses a 20-pip stop as an illustrative parameter.
These numbers are part of ICT’s narrated example, not evidence of an actual fill or a generally appropriate risk setting. The chart is required to determine precisely where the measurement was anchored and how the cited stop related to the candles. ICT’s broader point is that the stop in his illustration would have allowed room for movement beyond the stated retracement level and into the three-candle bearish order block.
He then describes price trading lower and sweeping Friday’s low. After separating the earlier London-session action from the new session, he identifies another retracement as a potential short opportunity, with Friday’s low and the developing intraday low serving as the referenced targets.
Monday and Sunday Context for the EURUSD Example
ICT advises viewers at 2:11 to generally exclude Sunday data from this style of analysis. Later, at 4:38, he says that Monday analysis should refer back to Friday’s data.
He gives Sunday gaps as an exception worth considering. His stated framework is to watch for a gap fill and then for movement in the direction associated with the opening gap. This is ICT’s market interpretation in the lesson; the transcript does not provide testing or performance evidence for the rule.
Key Lessons From the ICT Forex OTE Example
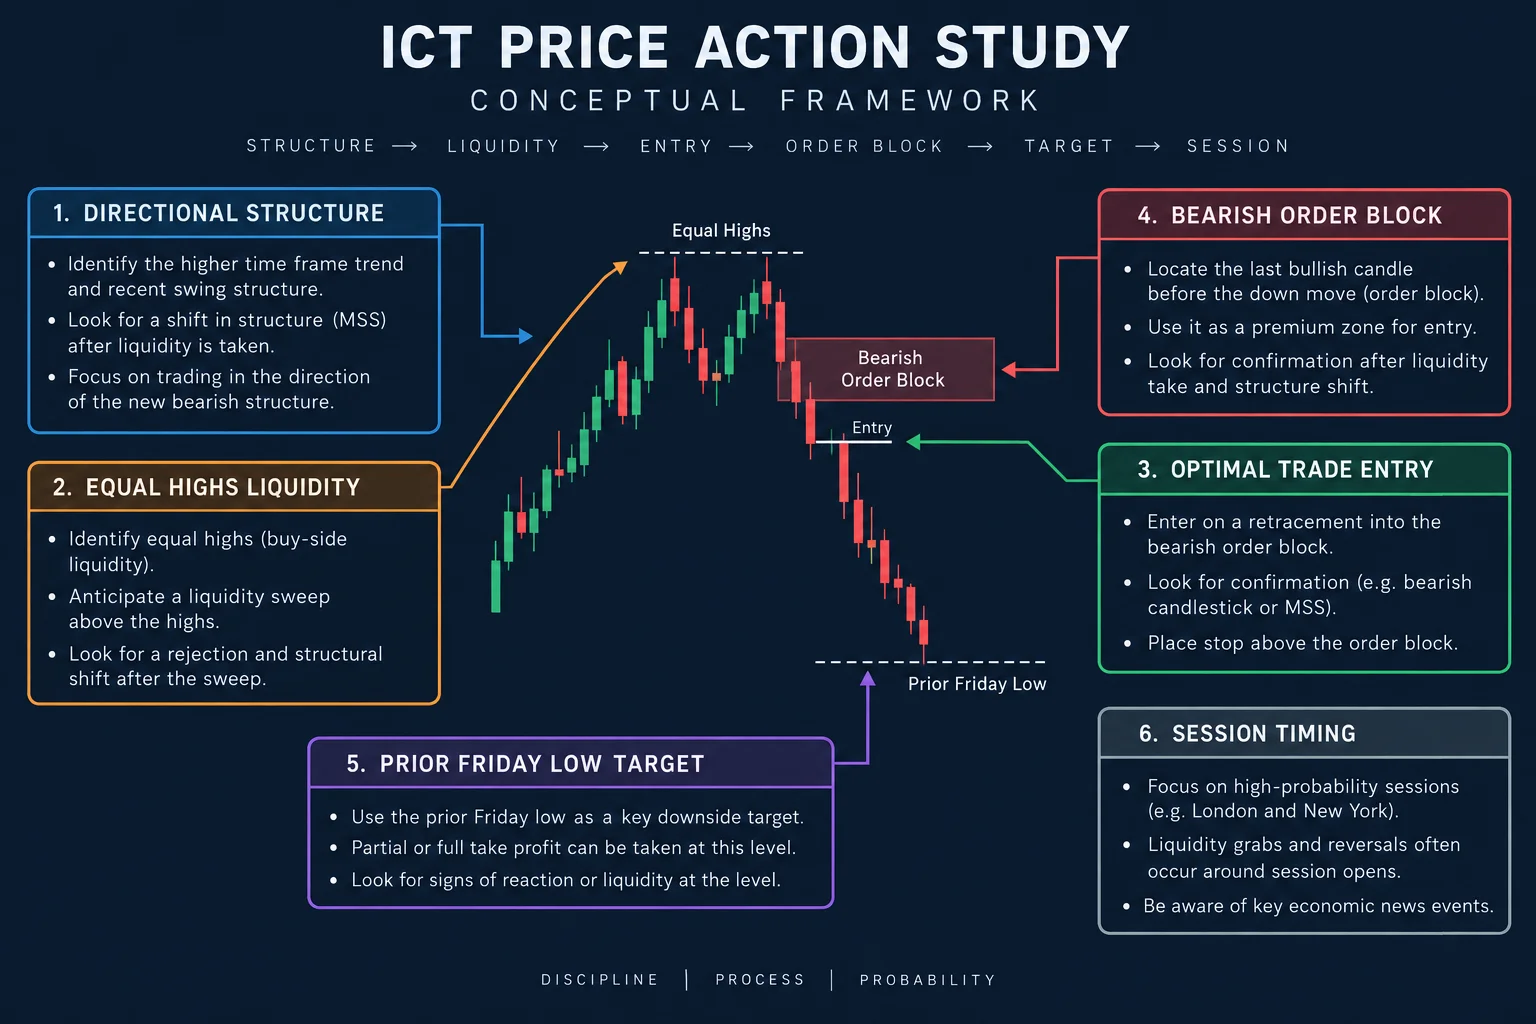
The example presents OTE as one component in a larger narrative, not merely a retracement percentage. ICT combines directional structure, a three-candle bearish order block, session timing and a prior low as the intended destination. Near 4:07, he summarizes the recurring concepts as previous-day highs and lows, time of day, and rebalancing toward an area he regards as overbought or oversold.
For study purposes, viewers can separate the lesson into three questions: What level does ICT believe price is seeking? During which session does the setup develop? Where does the retracement overlap his defined bearish order block? That approach preserves the logic of this specific example without treating the narrated setup as a verified edge or a recommendation to trade.
Primary source and further reading
- The original ICT Forex OTE Example: EurUsd: use the timestamp links in this article to compare the explanation with its source.
- YouTube embedding documentation: platform guidance for the external watch link above.
- 17 CFR 4.41: disclosures concerning hypothetical performance: a regulatory reference relevant to hypothetical trading examples, not a statement that a particular recording or this article meets every legal requirement.
Watch the original ICT lesson on YouTube
This article is educational commentary on the linked video and is not investment advice or a performance promise.




