
How we researched this article
BestProps used document-based research from primary firm sources, checked September 25, 2026. The complete source list, scope, limitations, and commercial-state record appear near the end of this article.
In ICT Forex Price Action Lesson: EurUsd Market Maker Sell Model, ICT narrates an intraday EUR/USD example through the framework he calls a “market maker sell model.” His central lesson is not simply to sell a rising market. It is to anticipate volatility, identify a move above a prior consolidation, and plan how a potential reversal could deliver price toward liquidity below earlier lows.
The source is a narrated chart recording, but the transcript cannot independently verify the chart’s prices, the displayed orders, or the reported executions. The model and market-mechanism explanations below should therefore be understood as ICT’s interpretation, not as proof of how interbank trading works or of a repeatable trading edge.
Volatility provides the session context
ICT begins by connecting the lesson to the economic calendar. At 0:27, he says EUR/USD had a significant scheduled news driver that day, whereas earlier sessions had offered little euro-related news. In his teaching framework, expected volatility helps determine when a meaningful price move is more likely to occur.
He also emphasizes that the calendar is only part of the process. The practical distinction is between context and setup: an anticipated volatility event may focus attention on a session, but it does not by itself establish an entry, direction, or risk plan.
The sell-model sequence
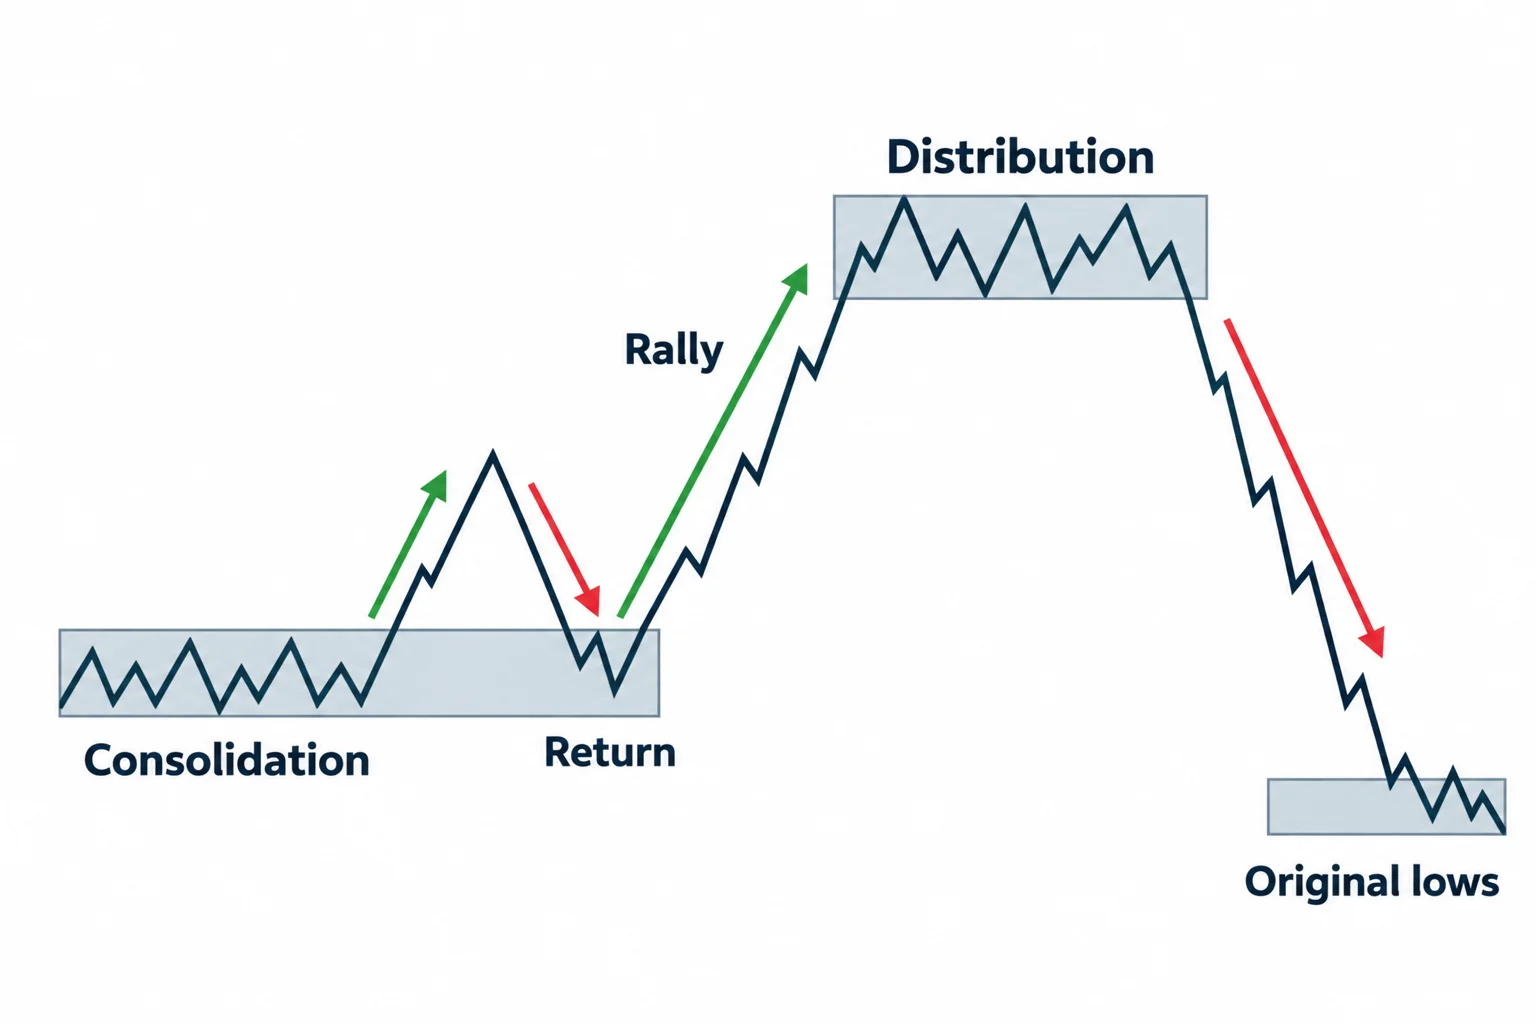
At 1:15, ICT identifies the displayed structure as a market maker sell model. He first asks viewers to pause and study the unannotated chart, making the segment a useful pattern-recognition exercise.
His annotations describe the following sequence:
- Price forms a relatively small consolidation.
- It leaves that range and later returns to it.
- A subsequent rally reaches above the nearby structure.
- ICT interprets the upper area as a reversal and distribution zone.
- The original consolidation and lows beneath it become downside objectives.
ICT presents several upper levels as possible short-entry or distribution areas. His terminology includes a “smart money reversal,” but the transcript alone does not establish that identifiable interbank participants actually entered there. A more general educational reading is that he sees the rally as a failed expansion above a range, followed by a return toward prior balance and liquidity.
Planning before the move
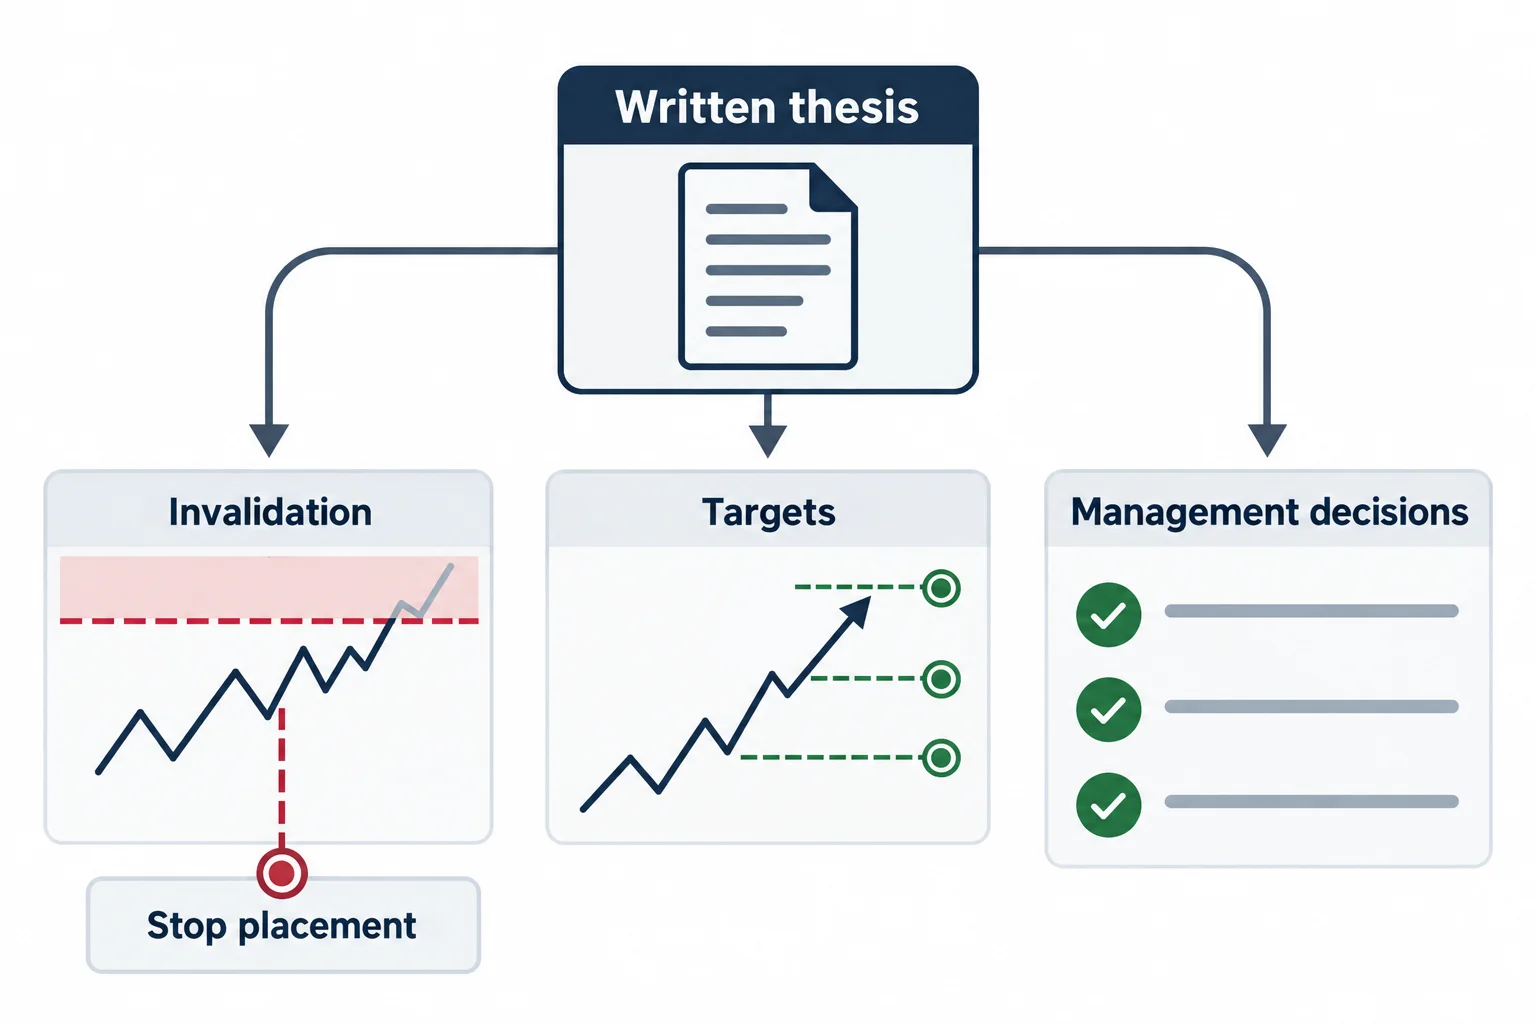
A major theme is documenting expectations in advance. Beginning around 4:13, ICT explains that he placed text annotations directly on the TradingView chart. He says these notes recorded his intended stop placement, targets, and management decisions before the subsequent price movement.
That process is more broadly useful than any particular label attached to the setup. A written plan can specify:
- what market condition would support the idea;
- where the idea would be invalidated;
- which prior highs or lows are relevant;
- where partial exits would be considered; and
- what evidence would show that the original premise is wrong.
Advance documentation can help separate a genuine forecast from a retrospective chart explanation. It does not, however, establish profitability or eliminate execution risk.
Liquidity and the proposed downside draw
During the narrated example, ICT says he wants to sell as EUR/USD pushes to a new high at 7:49. He then identifies stops beneath what he describes as relative equal lows and expects price to move toward that area.
At 9:26, he frames those lows as the place where short sellers could cover positions. He also characterizes buyers above the earlier high as breakout traders chasing price. These are ICT’s inferred participant narratives; the chart pattern itself cannot reveal the identities or intentions of actual traders.
For a neutral price-action interpretation, the important elements are simpler: price extends above a reference high, fails to continue, and rotates toward clustered lows. Those lows serve as visible technical objectives because they mark prior support and an area where pending orders may be concentrated.
Partial exits rather than one all-or-nothing target
ICT devotes much of the example to trade management. At 10:55, he describes taking an initial partial exit beneath a nearby low and around a region he calls a bullish order block. He then narrates further reductions as price approaches relative equal lows and an “outside liquidity pool.”
The educational principle is staged realization: instead of requiring the market to reach the furthest objective, portions of a position are closed at successive areas that fit the original analysis. ICT reports that the final remainder was eventually stopped out at 14:04. Thus, even within his own narration, the last portion did not continue to the more ambitious target.
He also mentions 117.40 as a separate short-term objective, but explicitly says that longer-horizon target is not the focus of the intraday demonstration. The transcript does not establish whether EUR/USD subsequently reached it.
What the lesson does—and does not—show
The lesson demonstrates ICT’s way of organizing a bearish intraday scenario: use a volatility catalyst as context, watch for a rally beyond nearby structure, define a downside draw toward earlier lows, and plan partial exits before the move develops. Near the end, he switches to a one-minute view to discuss the reported entries and reductions at 15:00.
The video also contains strong claims that price is manipulated and that ICT knows where reversals will occur. Those claims are opinions expressed by the speaker, not conclusions demonstrated by one selected example. The transcript provides no independent account records, complete strategy rules, sample of losing trades, or statistical testing.
Accordingly, the most transferable takeaway is the planning discipline rather than a promise of precision: define the setup, invalidation, objectives, and management steps in advance, then review what actually happened. This summary is educational commentary only and is not investment advice.
Primary source
ICT, “ICT Forex Price Action Lesson: EurUsd Market Maker Sell Model”, uploaded September 10, 2020.





