
Key takeaways
ICT’s Bitcoin Technical Talk PG13, uploaded December 14, 2018, presented a bearish price-action thesis forecasting Bitcoin could eventually reach $100, with $3,000 and $2,500 identified as nearer downside areas and $2,500 as a possible bounce zone rather than a return to prior highs.
Read the full summary
ICT’s Bitcoin Technical Talk PG13, uploaded December 14, 2018, presented a bearish price-action thesis forecasting Bitcoin could eventually reach $100, with $3,000 and $2,500 identified as nearer downside areas and $2,500 as a possible bounce zone rather than a return to prior highs. Around 2 minutes 47 seconds, ICT discussed the break below roughly $6,400 after months near that level and clarified that he did not trade Bitcoin, knew little about the cryptocurrency industry, and was covering it for interested students. His core lesson begins around 12 minutes, interpreting consolidation after a decline as order accumulation for continuation lower. The proposed sequence has retail traders buying apparent support, stops clustering below a recent low, sellers entering after the support break with buy stops above similar highs, price briefly running above those highs to collect buy-side liquidity, and the bearish move resuming. Around 26 minutes 26 seconds, he also looks left of equal highs for another liquidity reference, defines a range, and marks its midpoint as a potential reaction level. ICT advocates one directional narrative with a defined objective and invalidation rather than publishing opposing scenarios, while encouraging skepticism and independent review. The transcript does not verify orders, executions, performance, order-book activity, later outcomes, or a profitable trading edge, so the material remains historical educational commentary rather than investment advice.
How we researched this article
BestProps used document-based research from primary firm sources, checked September 25, 2026. The complete source list, scope, limitations, and commercial-state record appear near the end of this article.
In Bitcoin Technical Talk – PG13, uploaded on December 14, 2018, ICT presents a strongly bearish interpretation of Bitcoin’s price action. The discussion focuses on consolidation, stop placement, liquidity around similar highs and lows, and the importance of committing to a directional thesis rather than publishing enough scenarios to appear correct afterward.
This is a summary of ICT’s interpretation at that historical moment, not proof that the method provides a trading edge. The captions describe a chart shown in the video, but they do not independently establish unseen prices, executions, or what happened after the recording.
ICT Bitcoin Bearish Outlook
Near 1:36, ICT says he expected Bitcoin eventually to trade as low as $100. That was an exceptionally bearish forecast, not a confirmed outcome. He characterizes the earlier rise as speculative mania and explicitly acknowledges that he does not know much about the cryptocurrency industry. His analysis is therefore framed as a reading of price behavior rather than a fundamental assessment of Bitcoin’s technology or adoption.
At 3:40, he discusses the market breaking below an area around 6,400 after spending months near it. He also says he did not actively trade Bitcoin and was covering it because his students were interested in cryptocurrency. That distinction matters: the transcript records market commentary, not evidence of a filled position or verified performance.
ICT identifies 3,000 and 2,500 as downside areas of interest. Around 5:16, he argues that a move below 3,000 could reach 2,500 and that 2,500 might produce a bounce. He does not describe that possible bounce as the start of a return to the prior highs.
Bitcoin Consolidation and Liquidity Lesson
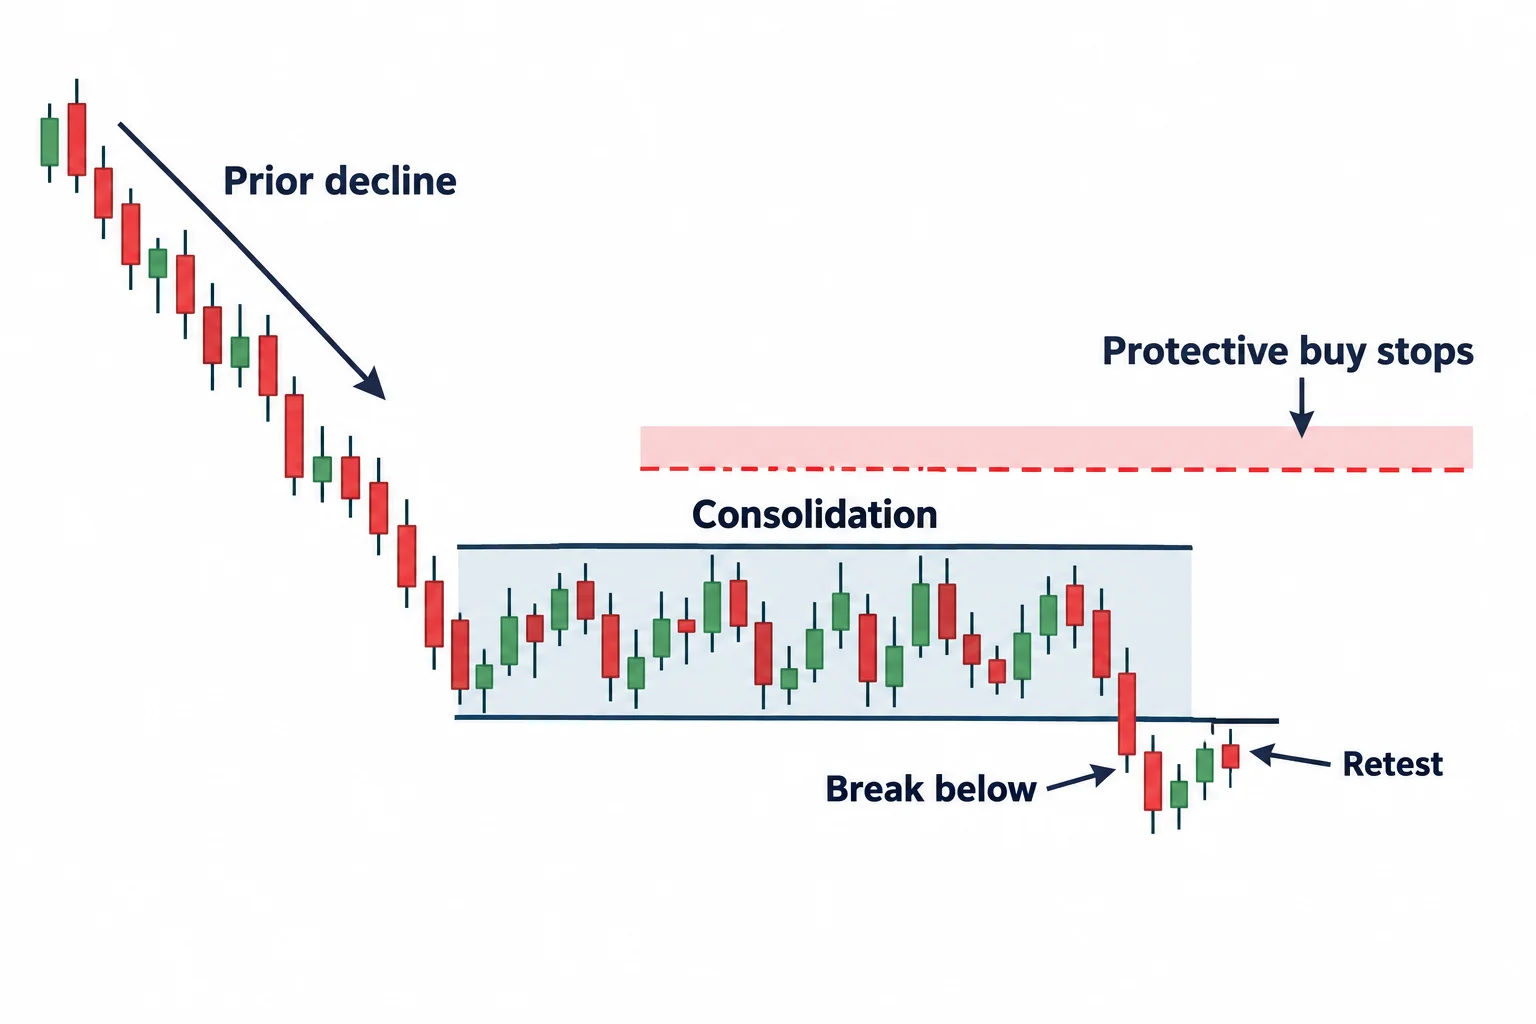
The most educational portion begins around 12:08. ICT describes Bitcoin as consolidating and interprets that pause as order accumulation before another decline. In his framework, a range is not automatically neutral. Its meaning depends partly on the move that preceded it.
At 12:38, he explains that the prior move into the consolidation was downward. He therefore looks for a continuation lower rather than assuming that an earlier low must act as support. He contrasts this with a conventional support-and-resistance reading in which traders may buy simply because price bounced from a similar area before.
His proposed sequence is:
- Price enters a range after a decline.
- Retail-oriented traders identify apparent support, including a diagonal trend line.
- A break below a recent low weakens bullish conviction and can trigger stops.
- Some traders then sell a retest and place protective buy stops above nearby highs.
- Price trades above those highs, which ICT interprets as a run on buy-side liquidity.
- The larger bearish move then resumes in his scenario.
This is ICT’s market-making interpretation. The transcript does not provide order-book records demonstrating who placed each order or proving that a particular class of participant caused the movement.
Why Equal Highs Signal ICT Bitcoin Liquidity
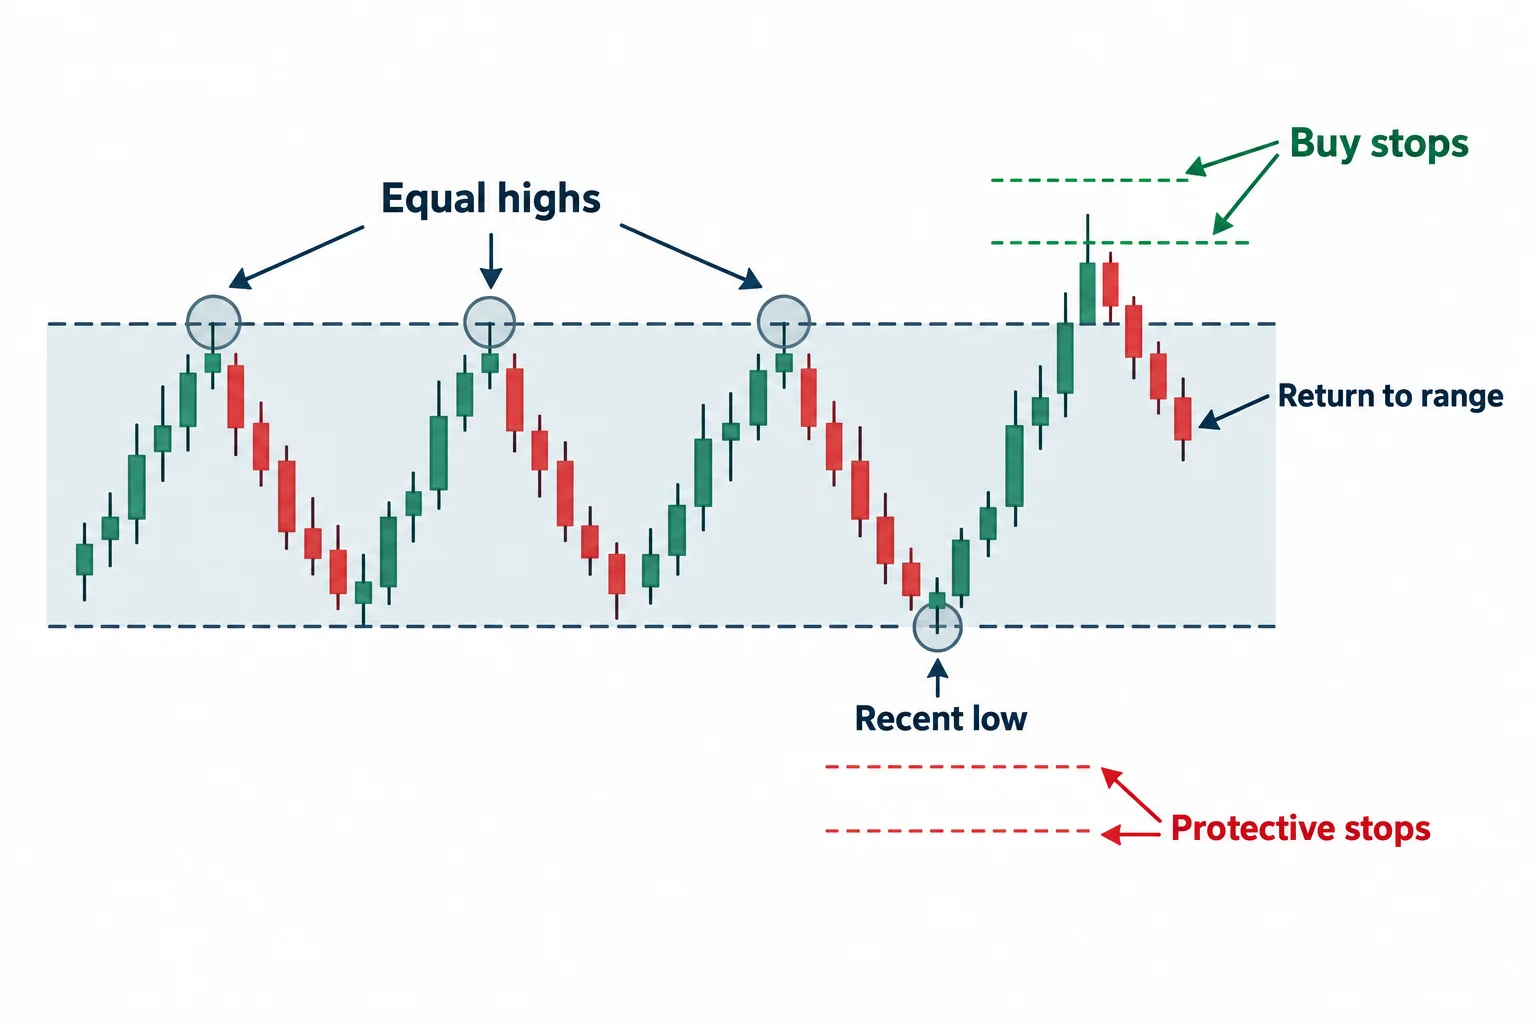
Around 15:00, ICT asks where buyers using a perceived support level would place their stops. He suggests that stops tend to cluster below a recent low. He then points to relatively uniform candle highs and treats the area above them as a likely pool of buy orders.
The explanation becomes more specific at 24:12. Traders who sell after a support break may place buy stops above apparent resistance or above similar highs. In ICT’s model, those orders provide counterparties for better-informed sellers. A brief move above the highs can consequently be interpreted as liquidity collection rather than a genuine bullish breakout.
At 26:26, he describes looking left of the equal highs for another liquidity reference, defining a range, and marking its midpoint. He says price reached the resulting level before turning lower on the chart he was presenting. Because the captions cannot show the chart itself, viewers should inspect this section of the source video rather than treating the transcript as a complete reconstruction.
Testing ICT Bitcoin Directional Bias
Another recurring theme is accountability. At 17:10, ICT criticizes analysts who publish opposing paths and later highlight whichever path resembled the result. He says he prefers one directional narrative and a defined objective, while accepting that a trade idea can simply be wrong.
He also tells viewers not to accept his claims automatically. Around 11:38, he encourages skepticism and independent review. That is the most broadly useful takeaway: a chart narrative should be stated clearly enough to test, including what would invalidate it, rather than being protected by vague or contradictory alternatives.
ICT Bitcoin Technical Talk Takeaways
Separate from ICT’s Bitcoin forecast, the session offers several general study questions:
- What was the dominant move before the current range?
- Where are traders likely to cluster protective stops?
- Does a move beyond a recent high or low show continuation, or does price quickly return to the range?
- What observation would invalidate the original directional thesis?
- Is an analyst documenting one testable idea or presenting every possible path?
These questions can help organize chart review, but they do not establish profitability. Bitcoin is volatile, and retrospective explanations can make market structure appear more certain than it was in real time. This material is educational commentary on a historical video, not investment advice.




