
Key takeaways
ICT’s Bitcoin 3900 Short Framework video presents a bearish sequence in which Bitcoin trades around equal highs, reaches a breaker, rejects, moves through a nearby low, and targets sell-side liquidity beneath prior lows.
Read the full summary
ICT’s Bitcoin 3900 Short Framework video presents a bearish sequence in which Bitcoin trades around equal highs, reaches a breaker, rejects, moves through a nearby low, and targets sell-side liquidity beneath prior lows. At 35 seconds ICT notes Bitcoin hasn’t run on equal highs yet; at 46 seconds he describes a return to the breaker; at 2 minutes 9 seconds he corrects the upper level to about 3903 and notes a referenced candle missed it by roughly 3 points; and at 2 minutes 13 seconds he says that liquidity was neutralized. At 2 minutes 53 seconds he projects a quick run into the upper area followed by a rollover, labels the structure a market maker sell model and distribution area at 3 minutes 1 second, and names 3000 as a possible downside target at 3 minutes 7 seconds. The recording documents no exact entry, fill, stop-loss, position size, invalidation rule, risk limit, time horizon, trade management, or outcome, so it is a contemporaneous market interpretation rather than a complete, verified, or reproducible trading system.
How we researched this article
BestProps used document-based research from primary firm sources, checked September 25, 2026. The complete source list, scope, limitations, and commercial-state record appear near the end of this article.
In the short video Bitcoin 3900 Short Framework, ICT presents a bearish interpretation of a Bitcoin chart. His framework centers on equal highs, a return into what he calls a breaker, nearby stop liquidity, and a larger pool of liquidity below prior lows.
The recording is a compact market commentary rather than a complete trading lesson. It outlines what ICT expected to happen from the chart shown at that moment, but the transcript does not establish an entry, fill, stop-loss, position size, or eventual result.
ICT Bitcoin 3900 Short Setup
At 0:35, ICT draws attention to Bitcoin trading around a set of equal highs, noting that price “hasn’t run on equal highs here on Bitcoin.” In his terminology, equal highs can represent an area where buy-side liquidity has accumulated.
He then describes price as turning back toward a “breaker” area at 0:46. ICT says he expects rejection from that region, followed by a move through a nearby low and then toward a larger liquidity pool beneath additional lows.
This creates the basic sequence behind the short framework:
- Price trades around or through equal highs.
- The move reaches an area ICT labels a breaker.
- ICT anticipates rejection rather than continued upside expansion.
- Price is then expected to seek sell-side liquidity beneath visible lows.
These are ICT’s chart interpretations, not independently verified rules or evidence that the sequence produces a reliable trading edge.
ICT Bitcoin Liquidity Above the Highs
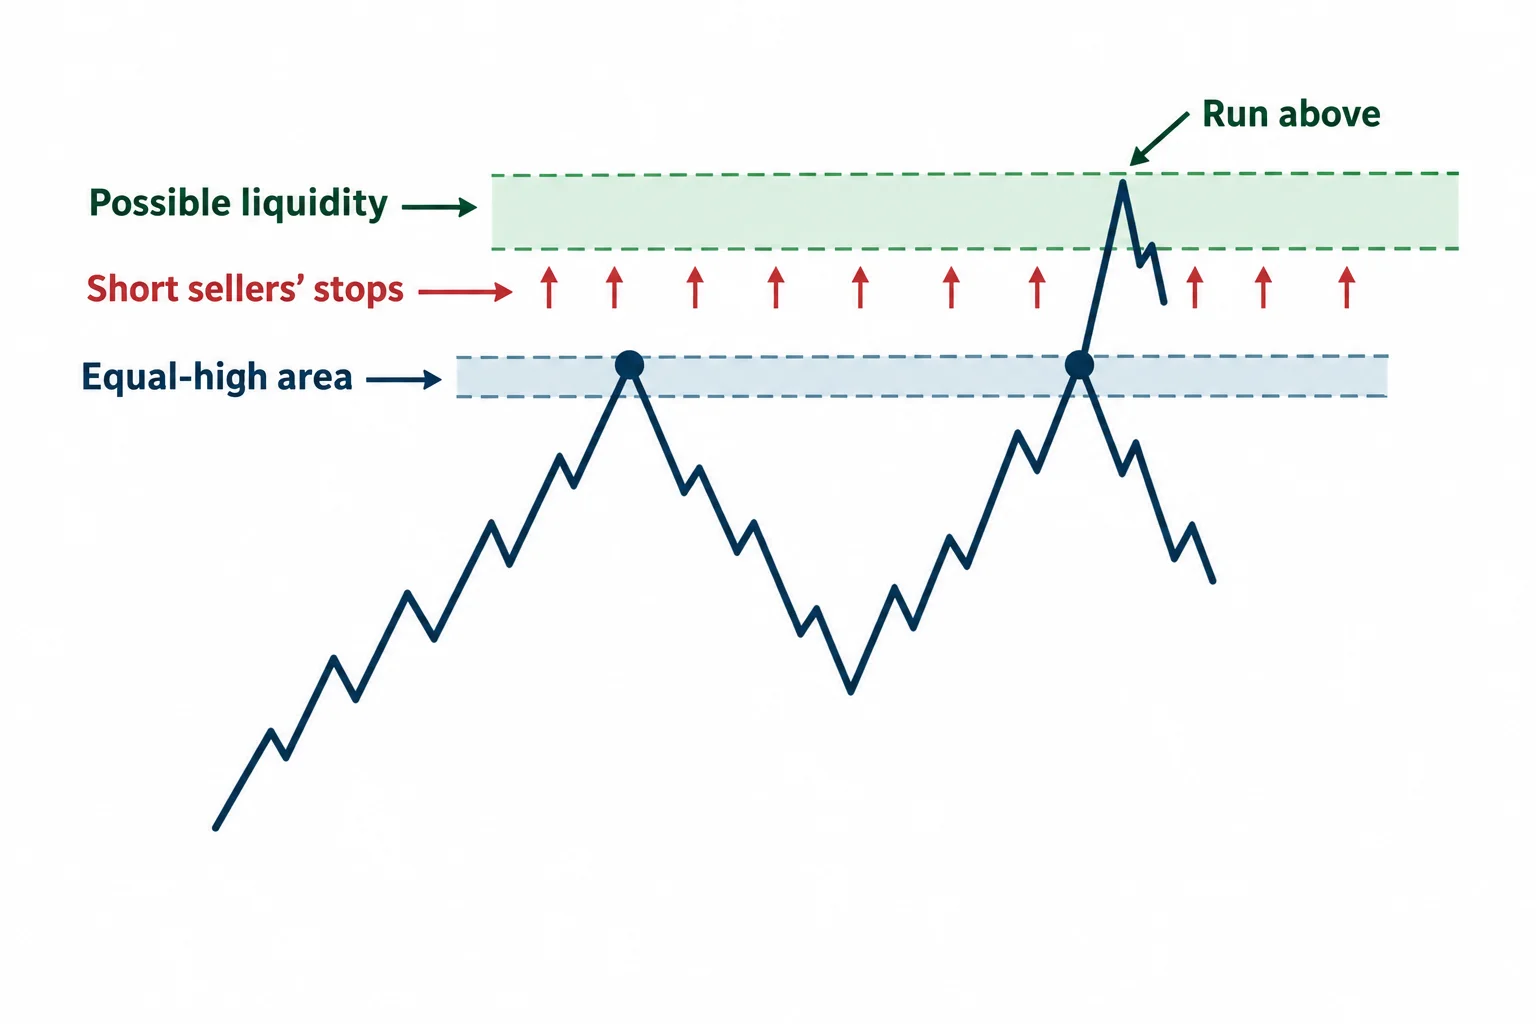
Later in the video, ICT revisits the level near the highs. At 2:09, he initially appears to read one value before correcting it to approximately 3903. He adds that the high of a referenced candle fell short of that level by roughly three points.
By 2:13, ICT says the liquidity resting around that area had been “neutralized.” In context, he appears to mean that price had already reached the orders associated with the prior highs. He specifically connects this activity with stops belonging to short sellers at 2:38.
This distinction matters within the framework. The equal-high area is not presented simply as resistance. ICT treats it as a location containing orders that price may reach before a bearish move develops. His projected short scenario therefore depends on the liquidity above the highs being addressed before price turns toward lower objectives.
ICT Bitcoin Short Projection Toward 3000
At 2:53, ICT summarizes the anticipated path as a quick run into the upper area followed by a rollover. He then labels the broader structure a “market maker sell model” at 3:01 and describes the current region as another area of distribution.
He closes by forecasting lower prices and mentions 3000 as a possible target at 3:07. This is a prediction made in the video, not a documented outcome. The captions end without showing whether Bitcoin subsequently reached that level or whether any hypothetical short trade would have succeeded.
ICT Bitcoin Framework Lessons and Limits
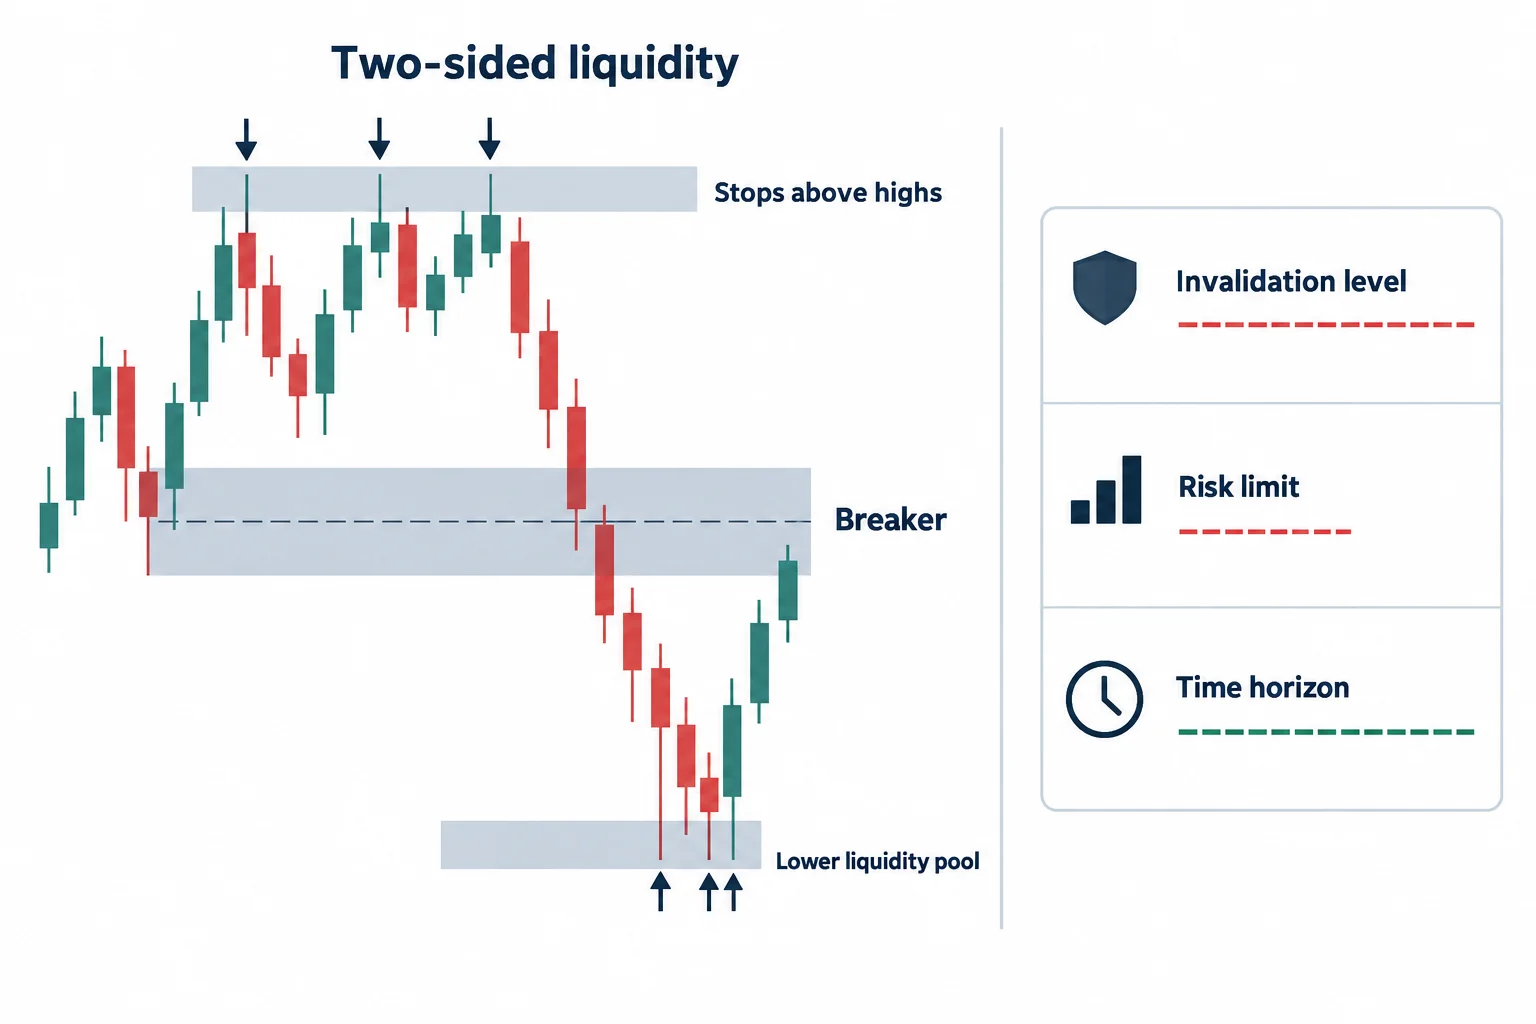
Viewed as a chart-reading example, the video illustrates how ICT organizes a bearish thesis around two-sided liquidity. Stops above highs are considered first; lows beneath the market then become potential downside objectives. The breaker supplies the proposed rejection area, while the lower liquidity pool supplies the directional target.
A fuller trade plan would still require information absent from this recording, including a precise entry condition, invalidation level, risk limit, time horizon, and rules for managing a position. The visible chart would also be needed to verify every level and drawing discussed in the narration. For that reason, the video is best understood as a brief explanation of ICT’s contemporaneous market view rather than a complete or reproducible trading system.
Primary source: ICT, Bitcoin 3900 Short Framework.





