
Key takeaways
ICT Volume 8, uploaded May 18, 2020, is a GBP/USD five-minute chart case study in a 20-part OTE pattern-recognition series, examining a bullish retracement from 8 thirty a.m.
Read the full summary
ICT Volume 8, uploaded May 18, 2020, is a GBP/USD five-minute chart case study in a 20-part OTE pattern-recognition series, examining a bullish retracement from 8 thirty a.m. through 11 a.m. New York time. ICT disregards limited Sunday trading when analyzing Monday, uses Friday’s high and low as prior references, measures a swing low to swing high with Fibonacci, watches for a pullback into the Optimal Trade Entry region, and targets a nearby short-term high, relatively equal highs, and ultimately Friday’s high. He treats Fibonacci as a visual aid for organizing dealing ranges rather than a force that moves markets, allows price to move below the preferred entry area without automatic invalidation, and says precise entry at a projected level is unnecessary. Playback beginning around 6 minutes 43 seconds purportedly shows entry, stop placement, commentary, and expansion above the referenced high, but the automated transcript cannot verify chart prices, execution type, position size, costs, slippage, risk, outcome, or the claimed liquidity above equal highs.
How we researched this article
BestProps used document-based research from primary firm sources, checked September 25, 2026. The complete source list, scope, limitations, and commercial-state record appear near the end of this article.
In OTE Pattern Recognition Series – Vol. 08, uploaded May 18, 2020, ICT presents a British pound (GBP/USD, or “cable”) Optimal Trade Entry example from a five-minute chart. The lesson focuses on a bullish OTE retracement during a defined New York session window and identifying prior highs as potential objectives.
This explanation is based on an automatically transcribed audio recording of the original video and cannot independently verify the chart’s visible prices, annotations, hypothetical fills, or subsequent movement.
ICT Volume 8 Session and Chart Context
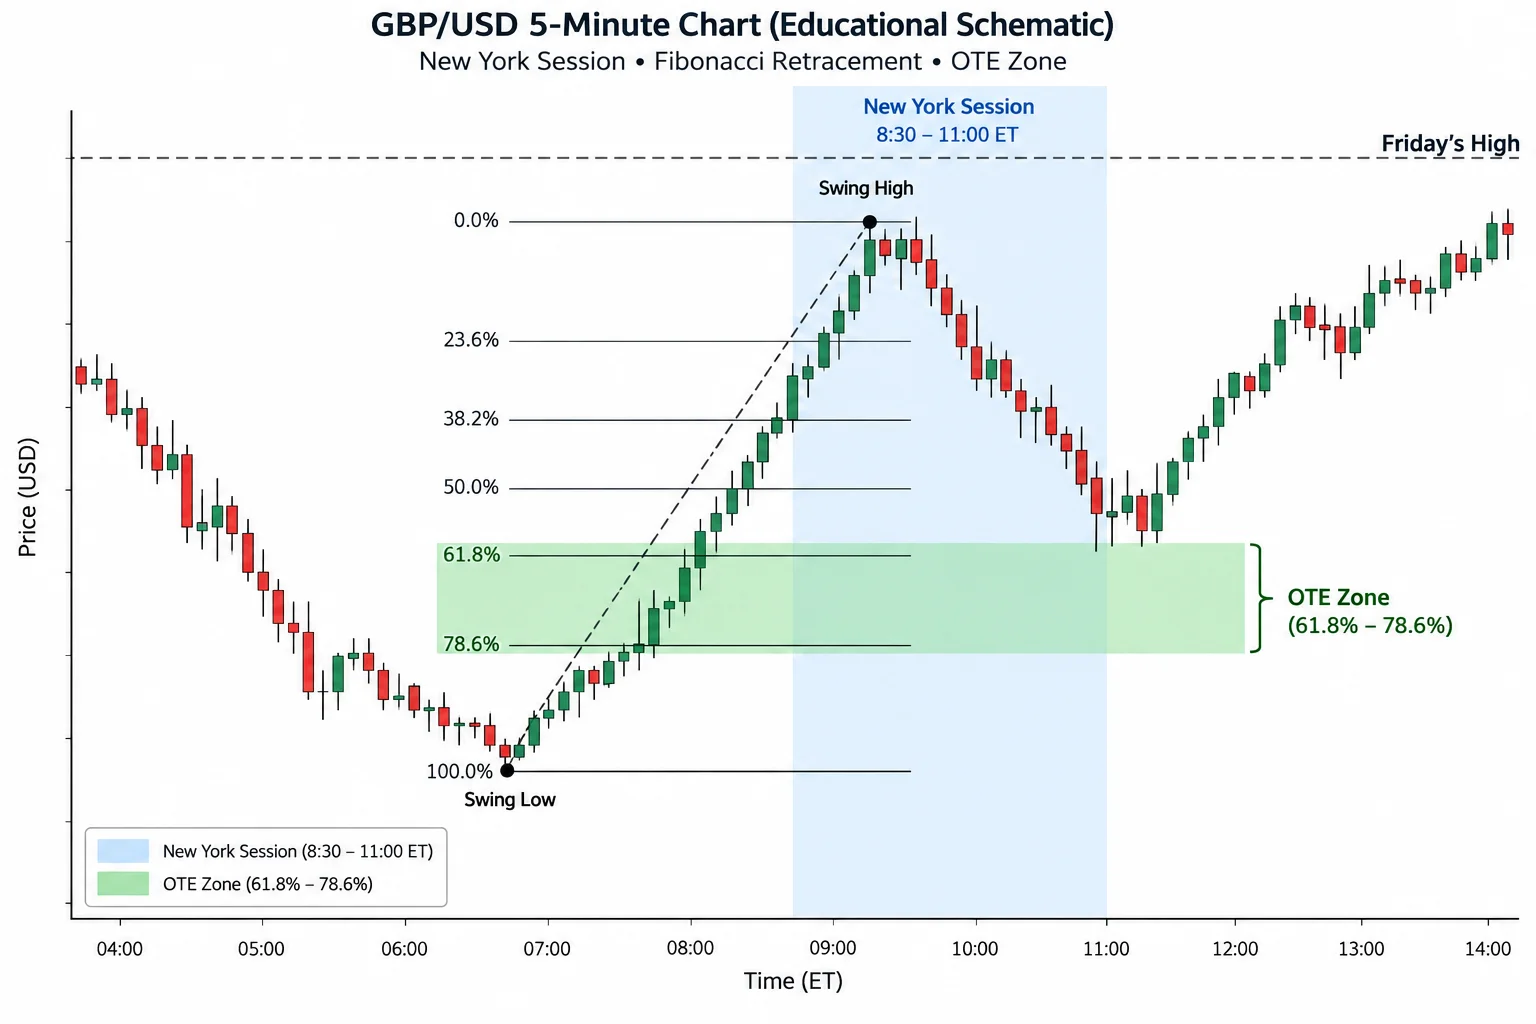
At 0:10, ICT identifies this as Volume 8 of a 20-part pattern-recognition series and names British pound “cable” as the featured market. He uses a five-minute chart and examines activity from 8:30 a.m. through 11:00 a.m. New York time.
ICT emphasizes that this window is broader than the session commonly labeled the ICT New York kill zone. In his presentation, it spans the core of the New York open and extends toward the middle portion of the London close. Viewers should not treat those labels as standardized market-session definitions; they are terminology used within ICT’s own framework.
The chart shows Monday, May 18, 2020. ICT also explains how he handles weekend chart data: when analyzing Monday, he disregards Sunday’s limited trading and uses Friday’s high and low as the prior reference points. That convention matters because the setup is framed around Friday’s high.
How ICT Frames the OTE Pattern
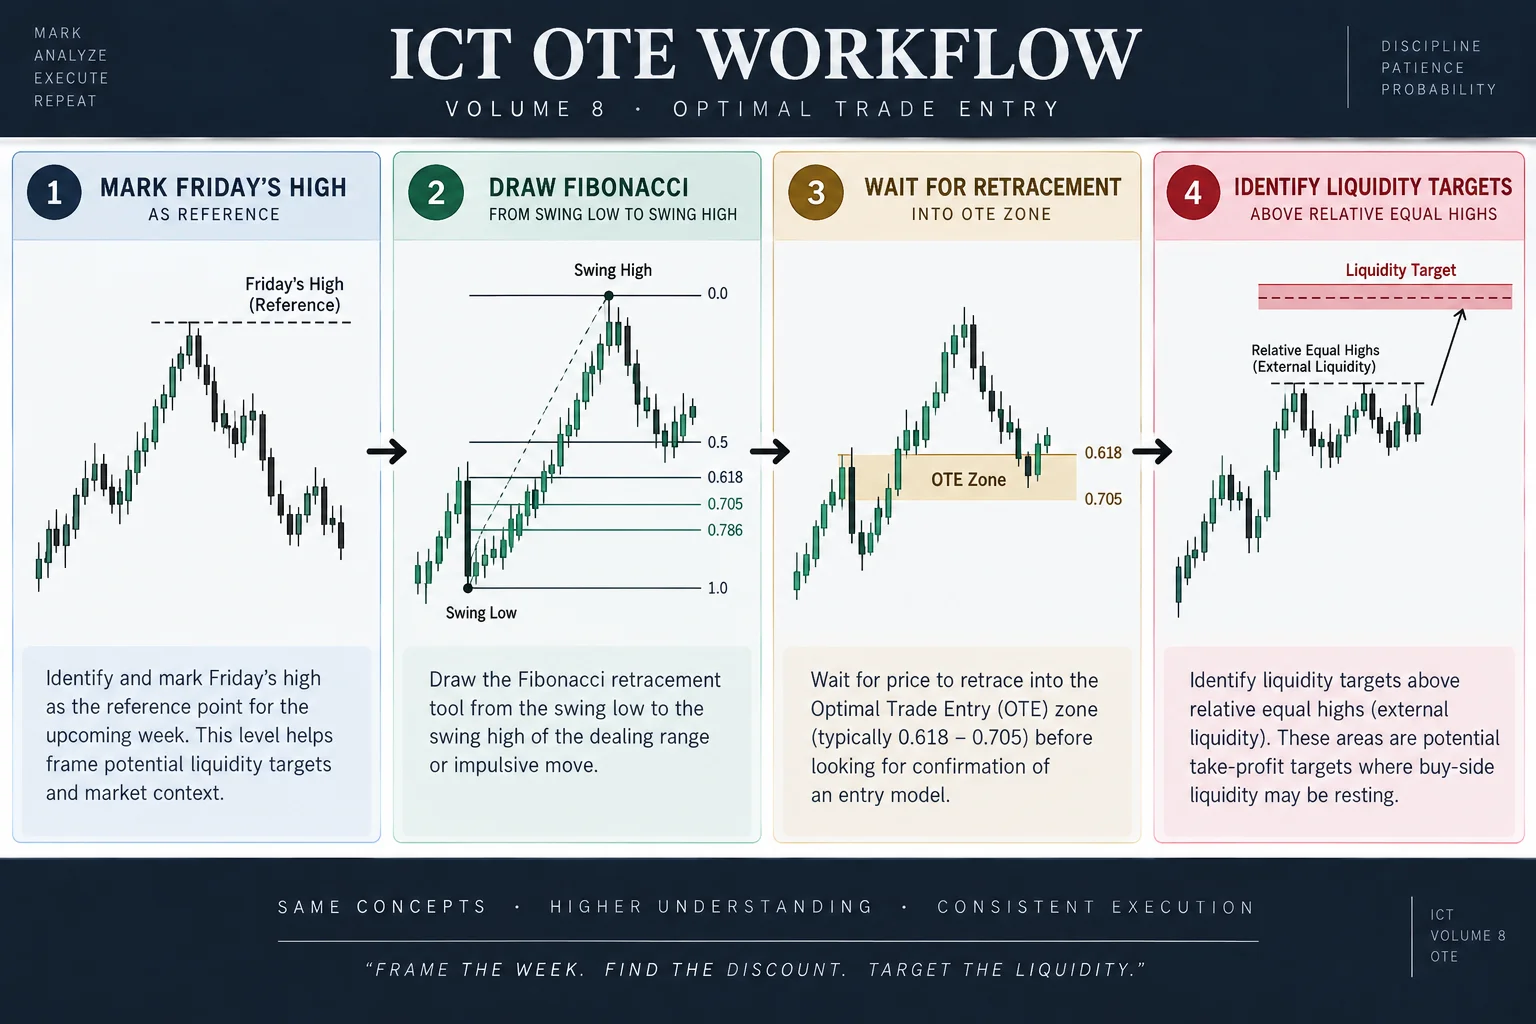
Beginning near 3:33, ICT marks Friday’s high and then draws a Fibonacci retracement across a selected upswing. His narrated sequence can be summarized as follows:
- Identify a five-minute swing low followed by a swing high.
- Measure the upswing with a Fibonacci tool to frame the retracement.
- Watch for price to pull back into the area ICT designates as OTE.
- Use nearby highs and Friday’s high as potential upside objectives.
- Allow for some movement below the preferred entry area without assuming that every fluctuation invalidates the idea.
The automated transcript renders one phrase describing the swing low as “kilo.” That wording is ambiguous and should not be assumed to be a defined technical term without checking the original chart and audio.
Why ICT Uses Fibonacci for OTE
A central clarification appears at 4:11. ICT says the retracement entered the OTE region before price moved higher, but cautions against expecting exact contact with every projected Fibonacci level. He states that markets do not move because of Fibonacci measurements; he presents the tool as a visual aid that helps newer traders organize a dealing range and recognize significant swings.
This distinction is important. The video does not offer an independent test showing that a particular ratio predicts price. Instead, ICT uses the overlay to communicate his reading of market structure. Experienced students may recognize the same swing without relying on the drawing tool.
ICT OTE Liquidity Above Equal Highs
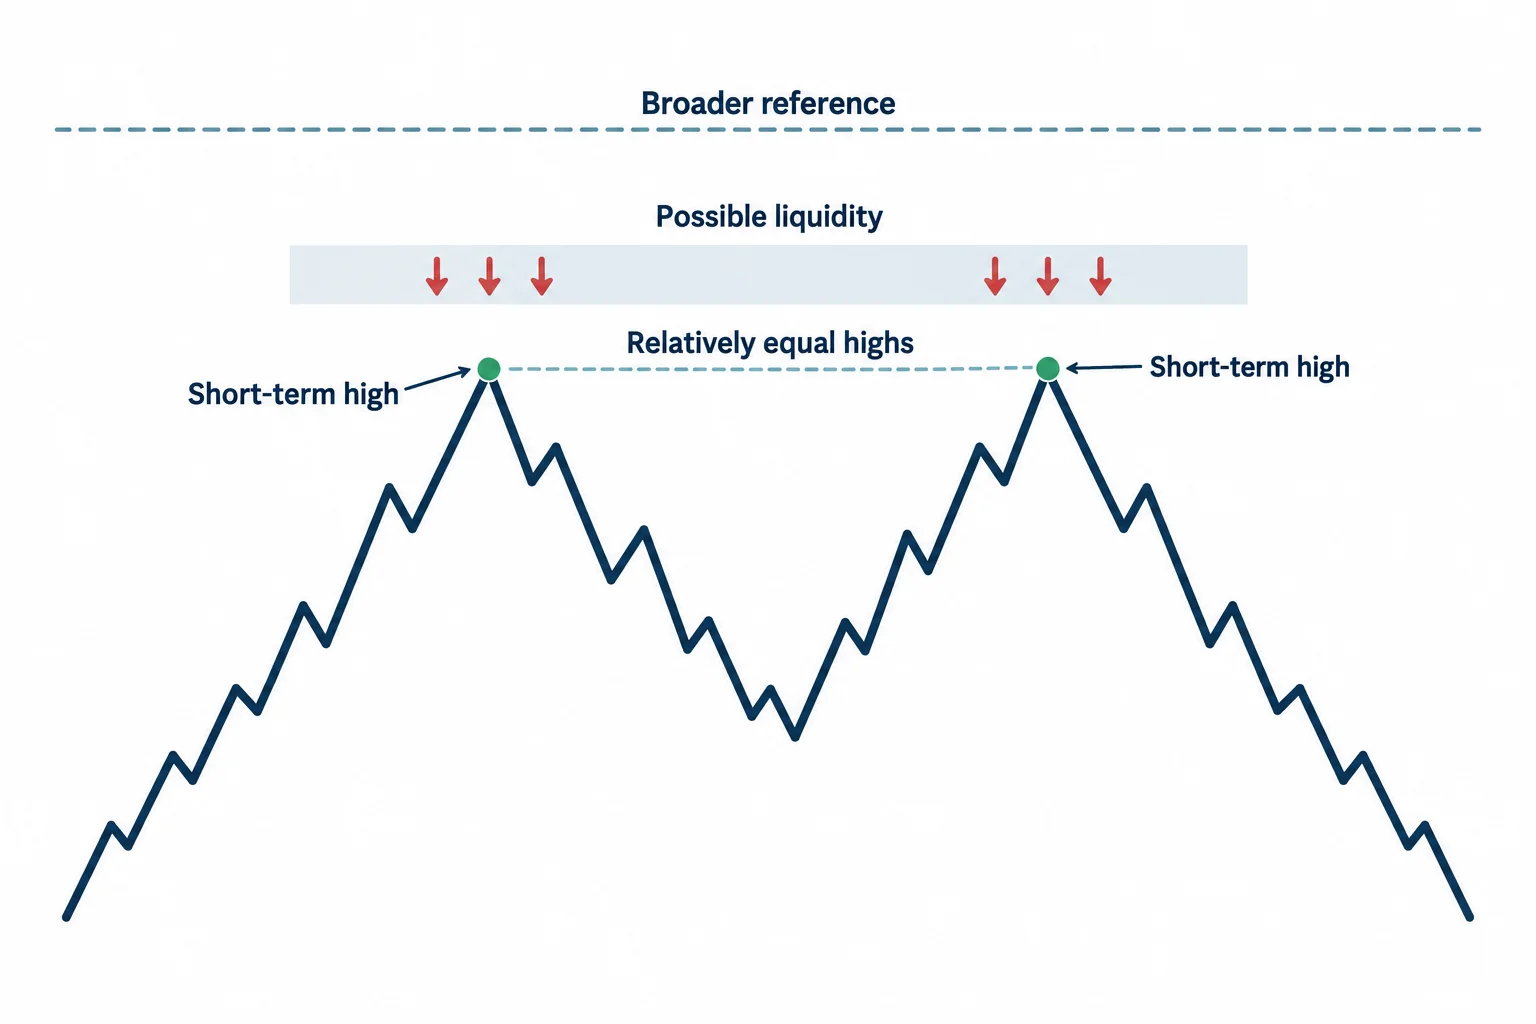
At approximately 6:15, ICT explains the intended destination. A short-term high was the nearer objective, while Friday’s high supplied the broader reference. He also points to two highs that he considers relatively equal and describes the area above them as liquidity.
Within ICT’s vocabulary, this means he expects orders to be concentrated beyond visible highs, potentially attracting price upward. That is ICT’s market interpretation, not something established by the transcript itself. The source does not provide order-book data or another direct measurement of the claimed liquidity.
ICT says he entered after sitting down at the chart while the pattern was already forming. He stresses that an entry does not have to occur at the most precise point inside the OTE region. The broader lesson is that his setup combines a retracement with a directional objective; it is not presented merely as buying whenever price touches a Fibonacci level.
ICT Pattern Recognition Playback
From 6:43, ICT introduces a recording that he says shows entry, stop placement, commentary, and subsequent expansion above the referenced high. He also mentions a possible order-block retracement and says such a move would not necessarily have changed his trade premise.
Because the source is an automatically transcribed audio track, it cannot independently establish what was visible in the playback or whether the displayed execution represented a live, simulated, or otherwise configured account. It also does not reveal position size, costs, slippage, complete risk, or net outcome. ICT’s statements about platform integrity are personal claims made in the video, not findings demonstrated by this lesson.
ICT OTE Pattern Explained for Learners
- Define the instrument, timeframe, and observation window before interpreting movement.
- Mark prior-session extremes and nearby swing points consistently.
- State the directional hypothesis and invalidation conditions in advance.
- Treat drawing tools as ways to organize observations rather than as causal mechanisms.
- Distinguish a narrated chart example from independently verified execution and performance evidence.
Volume 8 is a compact case study in ICT's OTE framework: a GBP/USD retracement is evaluated during a defined New York window, while prior and relatively equal highs provide the proposed upside draw. It is best used to understand how ICT connects time, swing structure, retracement, and target selection, not as a promise that the same pattern will recur or produce a profitable result.
Watch ICT OTE Volume 8
If the embed does not play, watch on YouTube.




