
Key takeaways
ICT applies Optimal Trade Entry to the June 2020 S&P 500 E-mini futures contract, using a bullish daily context and the prior Friday high as a liquidity objective before shifting at 2 minutes 28 seconds to a five-minute chart.
Read the full summary
ICT applies Optimal Trade Entry to the June 2020 S&P 500 E-mini futures contract, using a bullish daily context and the prior Friday high as a liquidity objective before shifting at 2 minutes 28 seconds to a five-minute chart. The setup focuses on the New York session from eight thirty a.m. to eleven a.m., an intraday rally above the 2,900 big figure, and a retracement into the 62% to 79% OTE zone, with 70.5% as the preferred sweet spot and three candles contacting the broader zone. Potential staged exits include the 0.5 range level, a standard-deviation projection near 2,922, the prior Friday high, and a Fibonacci projection near 2,936, with candle highs around 2,937 and a suggested rounded target of 2,935. ICT treats Fibonacci levels as a framework rather than the source of the trade premise, emphasizing alignment among higher-timeframe direction, prior-day liquidity, an intraday swing, a round number, and a session filter. The lesson reviews one historical chart and does not verify orders, fills, slippage, or repeatable profitability.
How we researched this article
BestProps used document-based research from primary firm sources, checked September 25, 2026. The complete source list, scope, limitations, and commercial-state record appear near the end of this article.
In OTE Pattern Recognition Series – Vol. 03, ICT takes the Optimal Trade Entry framework outside the foreign-exchange market and applies it to an S&P 500 E-mini futures example. The lesson connects a bullish daily context, a previous-day high, an intraday retracement, and a defined New York-session time window.
This is a review of the setup as ICT presents it, not an independently verified strategy test. The captions describe a historical chart example but do not establish actual orders, fills, slippage, or repeatable profitability.
ICT OTE Daily Pattern Context
At 0:10, ICT introduces the third installment and says the OTE pattern is not limited to forex. His example uses the June 2020 delivery contract for the S&P E-mini futures.
The analysis begins with a higher-timeframe sequence: a swing low, a swing high, a retracement, and then renewed upward movement. ICT characterizes the market as being within a larger daily OTE area. Although Fibonacci levels help him organize that retracement, he stresses at 1:24 that the Fibonacci tool is not the supposed source of the setup. In his interpretation, it supplies a framework while the more important feature is the liquidity objective.
With the daily context viewed as bullish, ICT identifies the prior Friday high as a plausible draw for Monday’s price action. He does not require certainty about whether price will stop at that high or continue through it. The practical purpose of the higher-timeframe analysis is simply to establish an upward premise and mark a previous-day high for use on the lower timeframe.
ICT OTE Pattern on the Five-Minute Index Futures Chart
ICT shifts to a five-minute chart at 2:28. He initially presents it without annotations and invites viewers to pause the video to search for the pattern before he adds the Fibonacci overlay.
The transcript identifies 2,900 as the relevant “big figure.” ICT says that a move into or through a major round-number area during the New York session can produce a bounce or retracement. That is ICT’s market interpretation in this lesson, not a statistical result demonstrated by the video.
He defines the session window used for this example as 8:30 a.m. through 11:00 a.m. New York local time. Because the instrument is a futures contract, he discusses movement in terms of the price range and “handles,” rather than forex pips.
How ICT Identifies the OTE Retracement Pattern
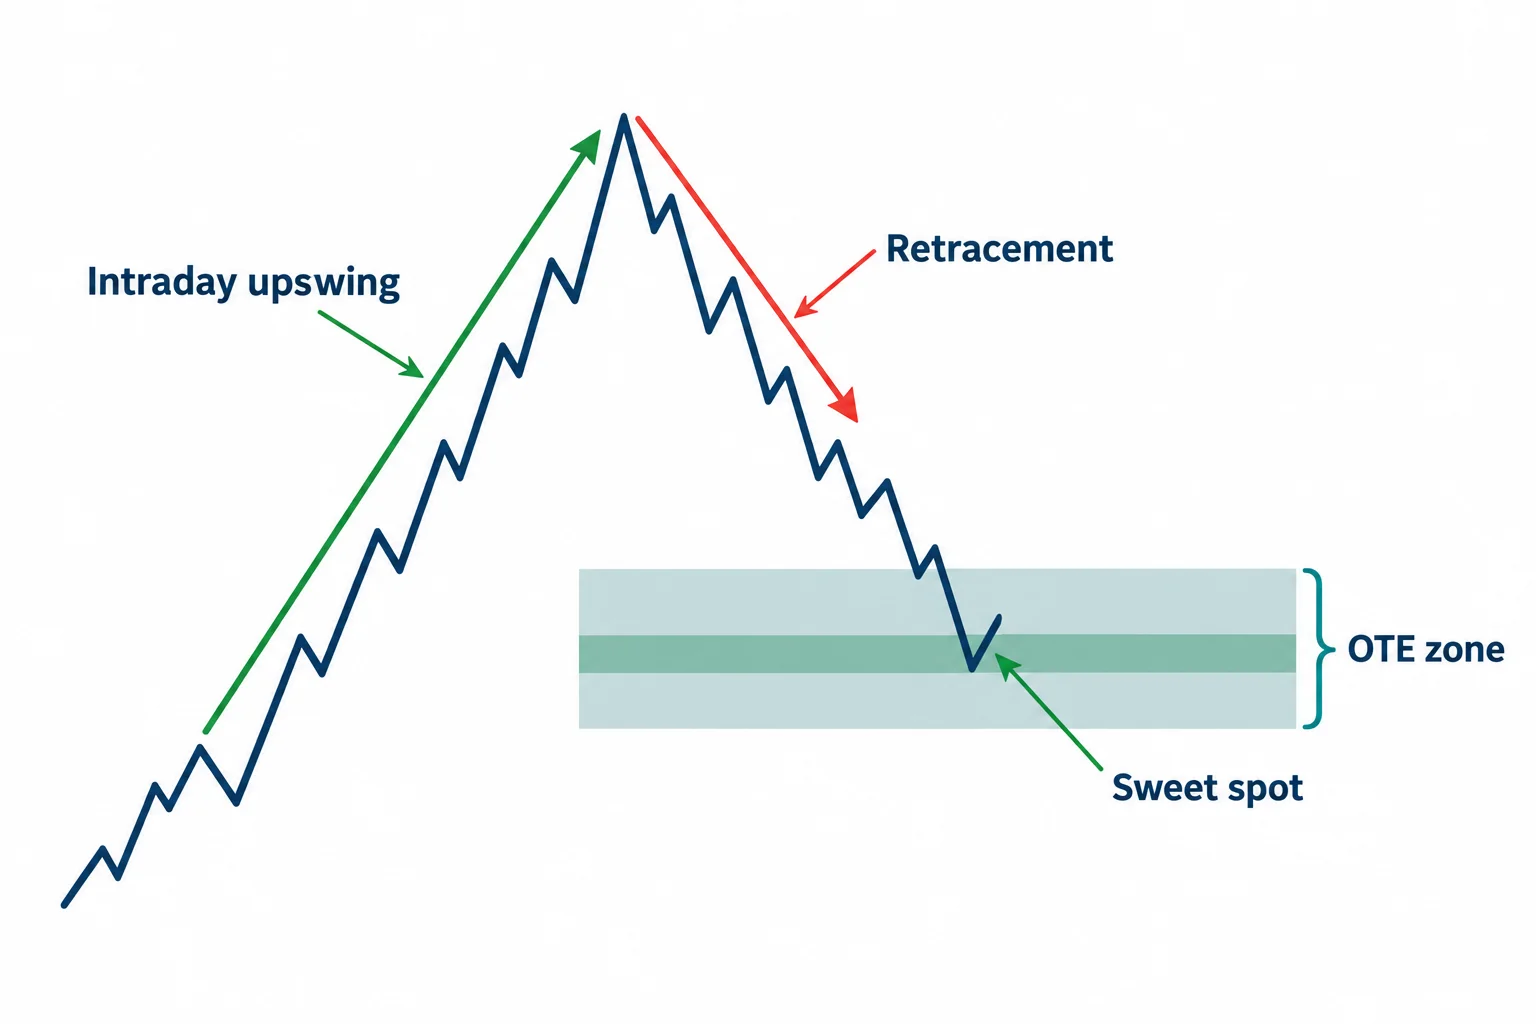
At 3:59, ICT places the Fibonacci framework over the intraday swing. As he describes it, price first rallies above 2,900 and then retraces toward that round-number area during the selected morning window.
The principal OTE region in this presentation runs from the 62% retracement to the 79% retracement. ICT calls 70.5% his preferred or “sweet spot” level. He points to three candles that, in his reading of the chart, offered contact with the broader OTE zone and therefore more than one possible entry location.
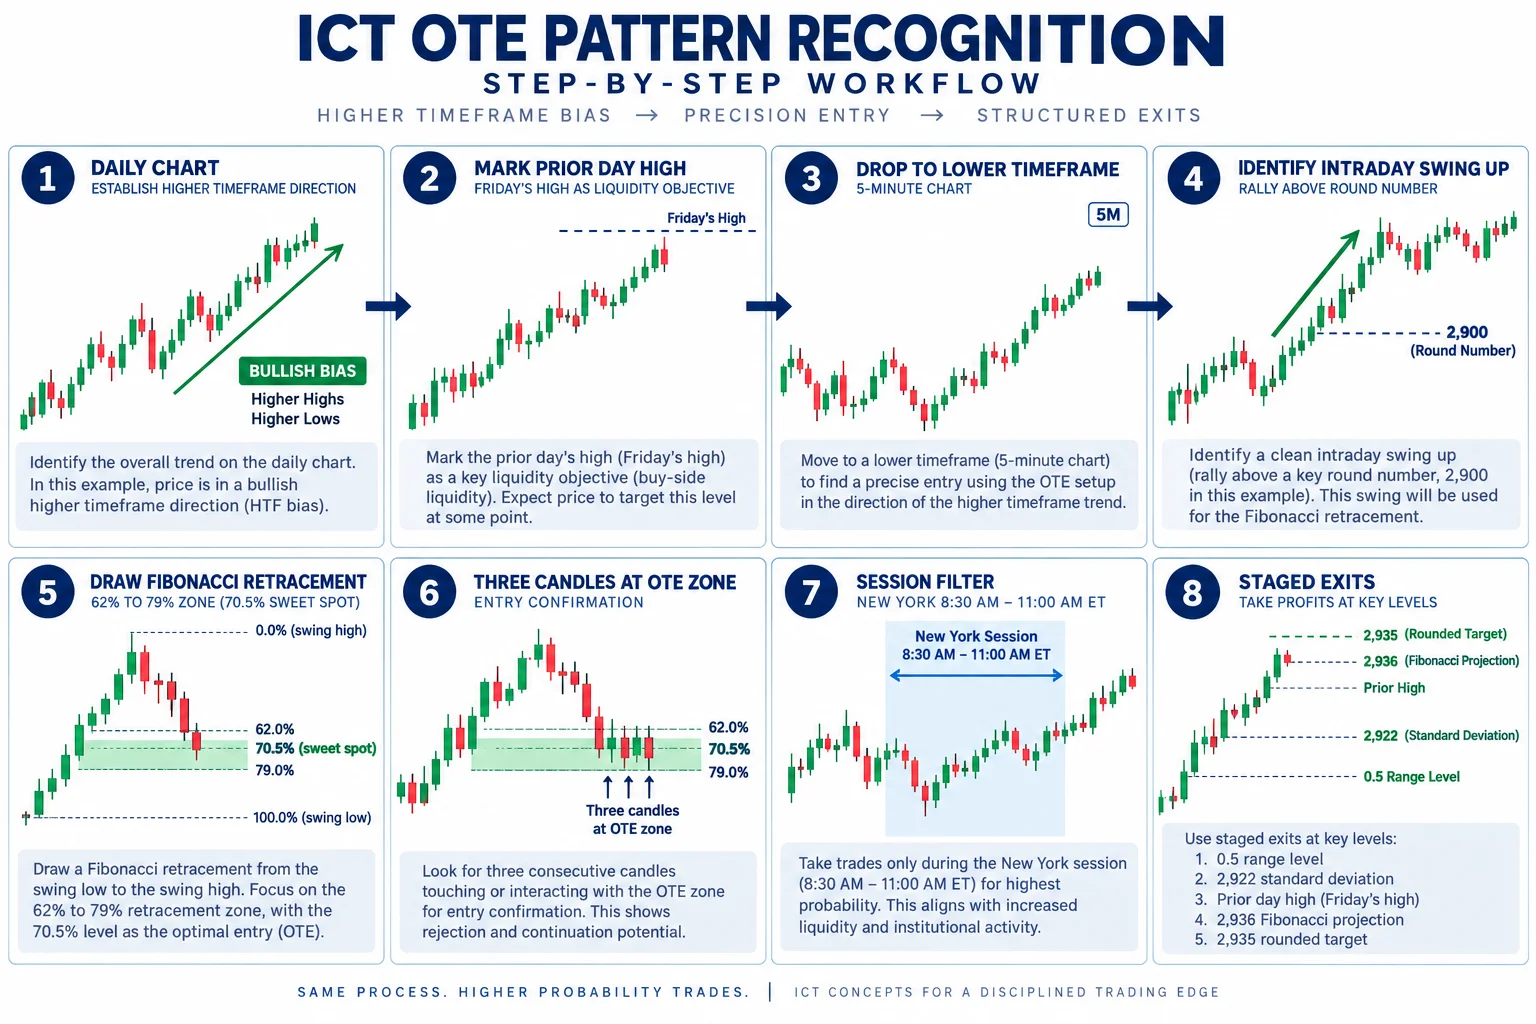
The pattern-recognition sequence can be summarized as follows:
- Use the daily chart to form a directional premise.
- Mark a prior high that ICT treats as a potential liquidity objective.
- Move to a short-term chart and limit attention to a chosen session window.
- Identify an intraday upswing followed by a retracement.
- Frame that retracement with the 62%–79% OTE zone, with special attention to 70.5%.
- Consider intermediate range projections before the prior-day high.
The important distinction is that the Fibonacci retracement and range projections structure the chart reading; they do not, by themselves, demonstrate why price must reverse or reach a target.
ICT OTE Pattern Targets in the Index Futures Example
From 4:56, ICT describes several potential partial-exit areas. The transcript refers first to a 0.5 range level, followed by a full standard-deviation projection around 2,922. He characterizes these as opportunities to reduce a hypothetical long position in stages rather than holding the entire position for one distant objective.
The prior Friday high remains the larger liquidity target in his narrative. ICT says the illustrated market subsequently moved above that high and approached a Fibonacci projection near 2,936, while the chart candle highs were described as approximately 2,937. He also suggests rounding a target down to the nearest five-point level (2,935 in this example) rather than insisting on the exact projection.
These figures document what ICT says about the displayed historical chart. Captions alone cannot confirm executable fills, whether the stated partials were actual trades, or the chart data visible outside the transcript.
ICT OTE Pattern Recognition Lessons from the Futures Example
The broader lesson is about aligning several layers of context rather than treating an OTE percentage as a standalone signal. ICT combines higher-timeframe direction, an old high, an intraday swing, a retracement zone, a round number, and a time-of-day filter. The staged objectives then provide a way to discuss how the anticipated move might be managed if the scenario develops as expected.
For study purposes, viewers can separate the lesson into testable questions: How was the swing selected? Was the directional premise defined before the intraday move? Did price enter the OTE zone during the specified window? Was the previous-day high reached, missed, or exceeded? Reviewing those questions across many examples would be more informative than assuming one narrated chart establishes reliability.
Related Resources
- ICT OTE Pattern Recognition Series – Volume 3 (Primary Source) — The original lecture covering index futures OTE pattern recognition with Nasdaq example.
- TradingView Charting Platform — For practicing OTE measurements on index futures charts (unofficial, untested indicator implementations).
- CME Group Product Specifications — Official contract specifications for E-mini and Micro E-mini index futures referenced in the lecture.
- Inner Circle Trader (ICT) Official Website — Source of the OTE methodology and pattern recognition framework.
Watch the complete primary source on YouTube: OTE Pattern Recognition Series – Vol. 03.




