
Key takeaways
ICT Volume 19 of the 20-part OTE Pattern Recognition Series uses a five-minute USD/JPY chart to illustrate a hypothetical bullish retracement during the eight thirty a.m.
Read the full summary
ICT Volume 19 of the 20-part OTE Pattern Recognition Series uses a five-minute USD/JPY chart to illustrate a hypothetical bullish retracement during the eight thirty a.m. to eleven a.m. New York session. ICT selects a low-to-high swing, identifies a retracement on the ten twenty five a.m. candle, notes a break above a prior high and treats previous-day and relatively equal highs as potential buy-side liquidity. The example frames an entry at 108.70 with three pips of drawdown and a ten-pip stop at 108.60, followed by objectives of roughly 14 pips at the old high, 20 pips at one standard deviation and 28 pips at one and a half standard deviations. Price had not reached the two-standard-deviation area during the recording, although ICT speculated it might do so in the Asian session. The lesson combines session timing, market structure, an OTE retracement, possible overhead liquidity and graduated standard-deviation targets, but provides no verified order, execution, subsequent outcome or evidence of a repeatable trading edge.
How we researched this article
BestProps used document-based research from primary firm sources, checked September 25, 2026. The complete source list, scope, limitations, and commercial-state record appear near the end of this article.
Volume 19 of ICT’s 20-part Optimal Trade Entry (OTE) Pattern Recognition Series presents a brief dollar-yen example on a five-minute chart. ICT uses the session to illustrate how he identifies a bullish retracement setup, frames a hypothetical entry and measures possible objectives with standard-deviation levels.
This article summarizes ICT’s interpretation of the example. The recording does not establish that the method has a repeatable trading edge, and the transcript alone cannot verify chart prices, order execution or the market’s later path.
ICT Dollar Yen Liquidity at Previous-Day Highs
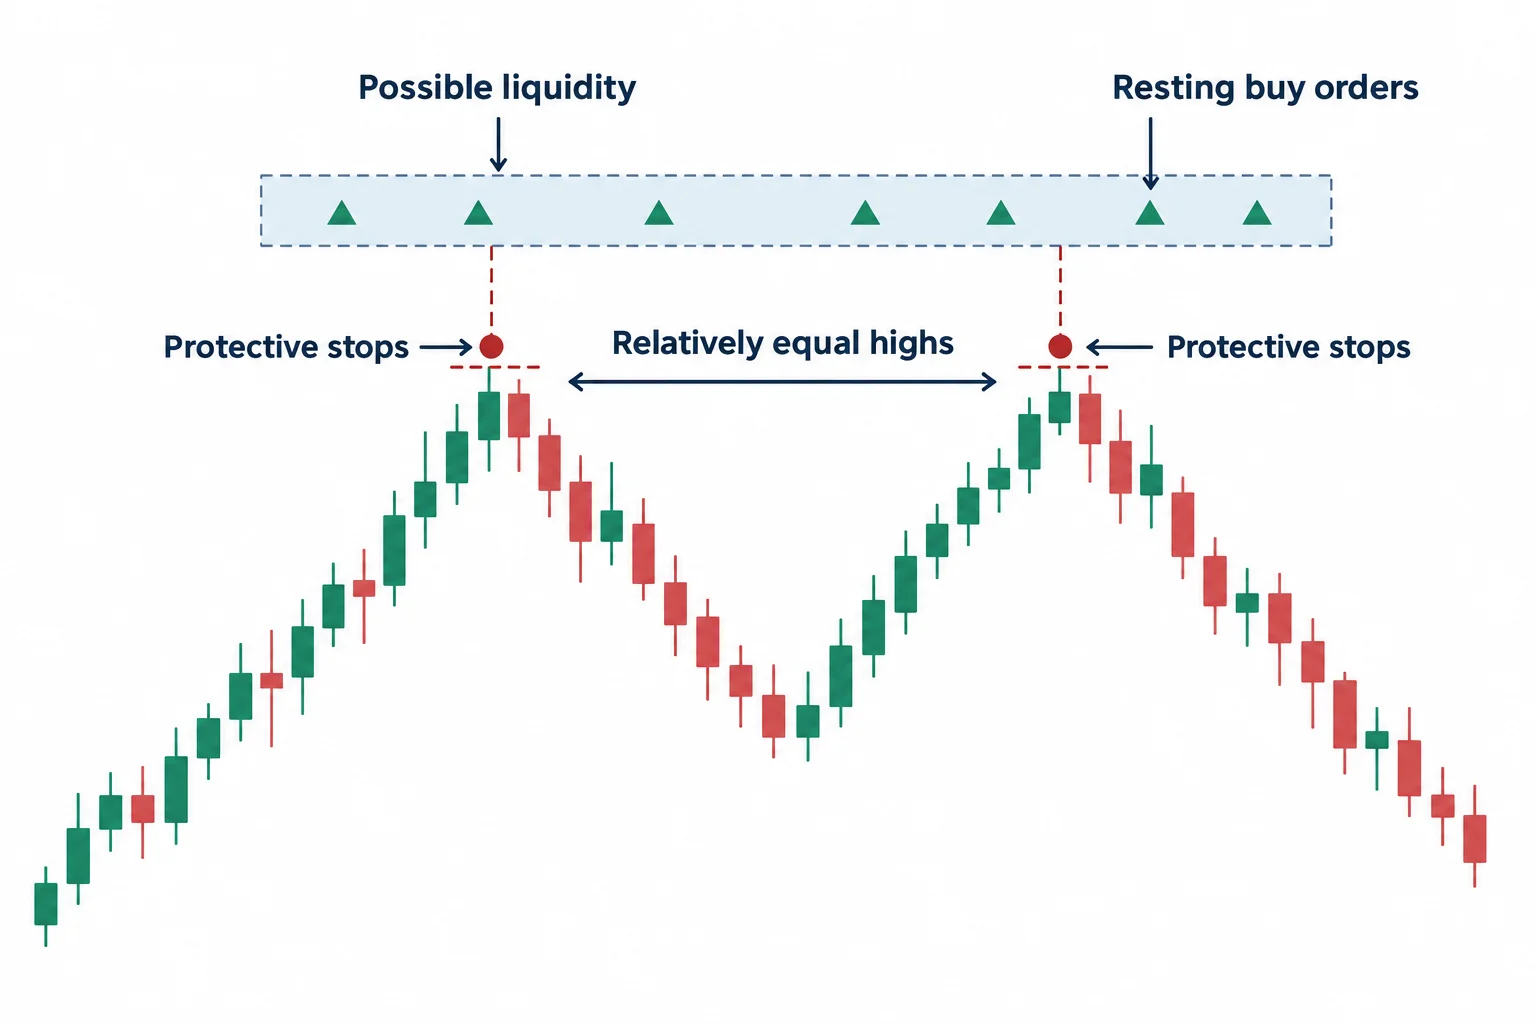
At 0:20, ICT introduces the dollar-yen chart and draws attention to the previous day’s high. He also identifies what he describes as relatively equal highs. In his interpretation, traders treating that area as resistance may place protective stops above those highs.
This is part of ICT’s broader liquidity-based framework: conspicuous highs are treated as potential locations of resting buy orders, including stop orders associated with short positions. In this lesson, that idea provides context for considering upward movement rather than automatically assuming that the apparent resistance must hold. It remains ICT’s market interpretation, not a fact that can be established from the transcript.
ICT Dollar Yen New York Session Window
After briefly inviting viewers to pause and study the unannotated chart, ICT adds his markings at 1:02. He defines the session window used in this example as 8:30 a.m. through 11:00 a.m. New York time.
That fixed window narrows the review to a particular part of the trading day. Rather than searching the entire chart for any retracement that resembles an OTE, the lesson evaluates the pattern within ICT’s selected session context.
Why ICT Favored the Bullish OTE Pattern
Beginning around 1:27, ICT says the chart produces OTE opportunities. He favors one setup because price had already made a comparatively deep move lower and then broken a prior high. He connects this reasoning to material in his separate scalping series, particularly its discussion of directional bias.
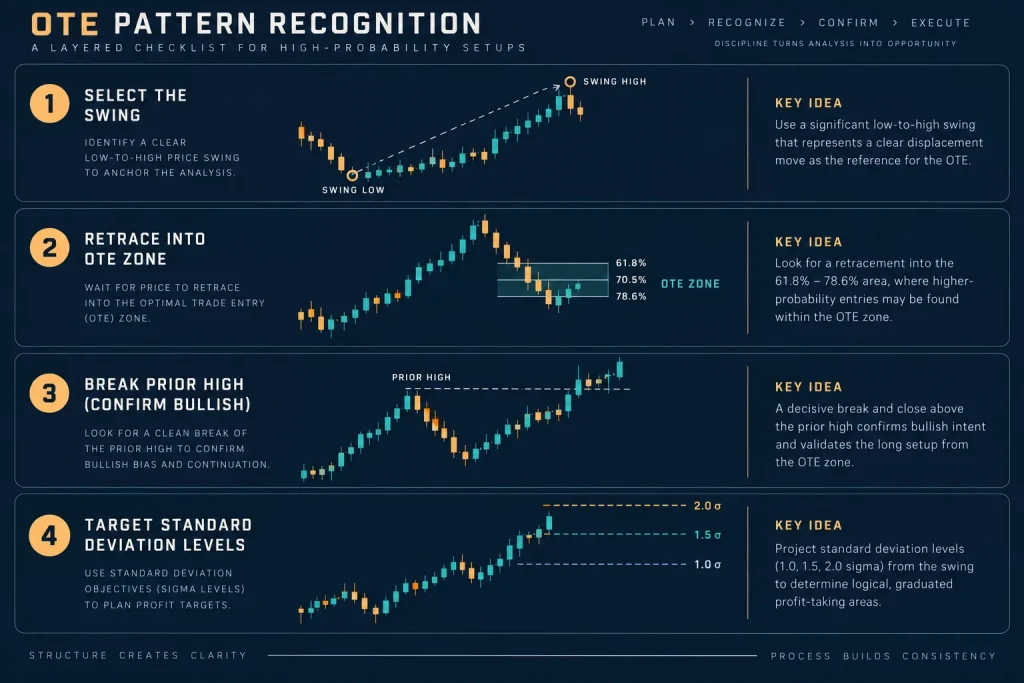
The sequence described in the lesson can be reduced to three elements:
- A relevant low-to-high price swing is selected.
- Price retraces into the area ICT labels the Optimal Trade Entry zone.
- A prior high has been broken, which ICT treats as support for a bullish bias.
The video therefore does not present OTE as an isolated Fibonacci-style retracement. ICT combines the retracement with session timing, a prior structural break and the possibility of liquidity above earlier highs.
ICT OTE Dollar Yen Entry and Risk Example
At 1:59, ICT measures from the selected low to the high and points to a retracement on the 10:25 a.m. New York candle. He states a hypothetical entry at 108.70, with three pips of drawdown and a ten-pip stop at 108.60.
These figures are retrospective annotations discussed by the speaker. The transcript does not show that an order was placed or filled, and it does not independently verify bid-ask spread, slippage or the exact prices visible on the chart.
ICT OTE Dollar Yen Targets in This Example
ICT then reviews several possible objectives. Around 2:22, he says the old high offered roughly 14 pips, the one-standard-deviation level about 20 pips and the one-and-a-half-standard-deviation level about 28 pips.
He also mentions the two-standard-deviation area, but his wording indicates that price had not yet reached it during the recorded commentary. At 2:42, he speculates that the market might move there during the Asian session. Because the video ends without a follow-up, no subsequent outcome should be inferred.
ICT OTE Pattern Recognition Takeaway
The educational value of this short installment is its demonstration of a layered checklist. In ICT’s analysis, the OTE retracement is considered alongside a defined time window, a break of a prior high and an overhead price area that may attract orders. Standard-deviation levels then provide a framework for discussing graduated objectives rather than one guaranteed target.
For independent chart study, viewers can distinguish between what was observable at the decision point and what became clear only afterward. That helps prevent a completed chart from making a setup appear more obvious than it would have been in real time. It is also important to treat the quoted entry, stop and pip figures as an illustration from this specific lesson, not as universal parameters or expected performance.
The primary source is ICT’s OTE Pattern Recognition Series – Vol., uploaded June 4, 2020. This summary is educational commentary and not investment advice.
ICT OTE Pattern Recognition Resources
ICT’s OTE framework is one trader’s personal method. The following general educational references cover the underlying concepts and are not endorsements of any specific approach.
- Fibonacci Retracement: Definition, Formula, and How It Works [7] an overview of retracement tools and how traders use them to identify potential support and resistance.
- Standard Deviation: Definition, Formula, and How It Works [8] an explanation of standard deviation as a measure of volatility and how it can frame graduated targets.
- What Is an Optimal Trade Entry (OTE)? [9] a general look at the concept of an optimal trade entry and its role in trade planning.





