
Key takeaways
ICT OTE Pattern Recognition Series Volume 18 presents a bearish September 2020 Treasury Bond futures example using a daily directional premise and five-minute execution model.
Read the full summary
ICT OTE Pattern Recognition Series Volume 18 presents a bearish September 2020 Treasury Bond futures example using a daily directional premise and five-minute execution model. ICT favors the September contract over June due to greater interest, identifies a high-to-low swing, lower turning point, retracement into the Optimal Trade Entry area and relative equal lows as liquidity targets, then expects the prior daily low near 177 and 2/32 to break. On the five-minute chart, the hypothetical short uses the 62% retracement level near an unverified 177 and 20/32, a later candle as the assumed fill, two ticks of adverse movement, $31.25 tick value, $62.50 illustrative drawdown per contract and a six-tick model stop. Targets include relative equal lows, the June 1 daily low and a two-standard-deviation objective. ICT reports a 29-tick move worth $906.25 per contract and continuation worth more than $1,650 per contract, but no brokerage records, actual fills or realized results verify the retrospective example. The educational sequence is to establish daily bias, mark lows and liquidity, identify a lower-time-frame swing, wait for an OTE retracement, and define entry, invalidation and objectives, with the single selected example providing no systematic evidence of a reliable trading edge.
How we researched this article
BestProps used document-based research from primary firm sources, checked September 25, 2026. The complete source list, scope, limitations, and commercial-state record appear near the end of this article.
Volume 18 of ICT’s 20-part Optimal Trade Entry (OTE) Pattern Recognition Series examines a bearish setup in September 2020 Treasury Bond futures. The lesson moves from a daily directional idea to a five-minute execution model, showing how ICT identifies a retracement zone, a possible liquidity target and a hypothetical short entry.
Watch “OTE Pattern Recognition Series – Vol.” on YouTube. The recording discusses market conditions as of June 2, 2020; the video was uploaded on June 3, 2020.
ICT OTE Volume 18 Daily Chart Premise
At 0:18, ICT identifies the example as the September 2020 delivery month for Treasury Bond futures. He says that this contract had more interest than the nearby June contract at the time, which is why he selected it for the lesson.
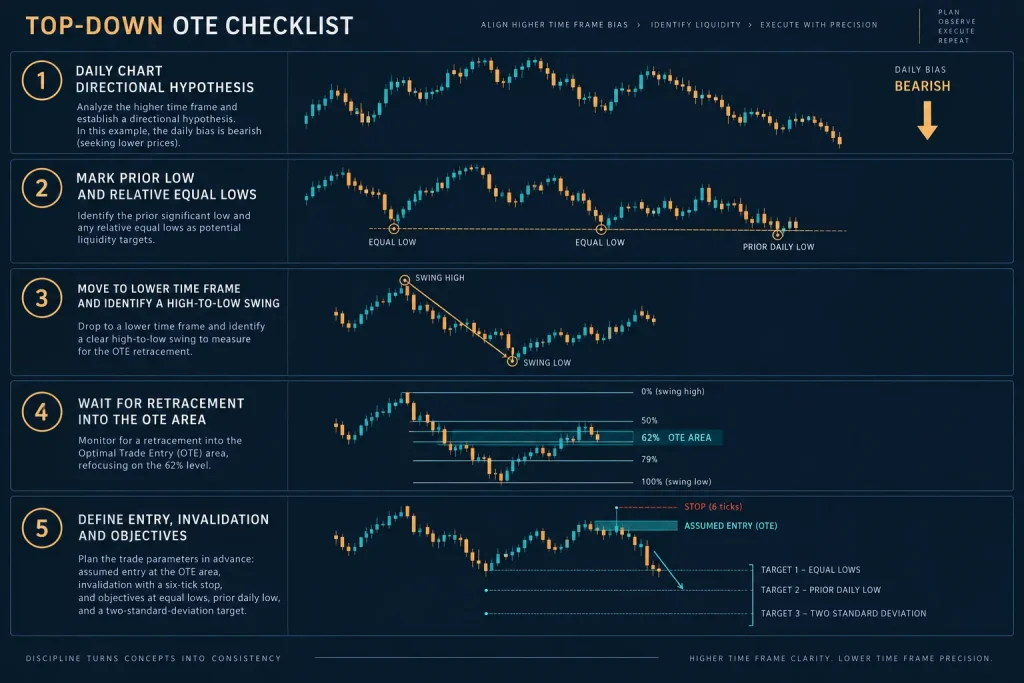
The analysis begins on the daily chart. ICT describes a move from a high to a low, followed by a retracement and a reaction on June 1. He then asks whether price is more likely to exceed the relevant candle’s high or low. His bearish interpretation rests on three observations:
- The chart had formed a turning point followed by a lower turning point.
- Price had reacted within what ICT labels an optimal trade entry area.
- Relative equal lows appeared below price and were treated as a potential objective.
At 1:11, ICT answers that he expects the low (not the high) to be taken. He marks the prior daily low so it will remain visible after changing to the five-minute chart. The transcript renders that low as 177 and 2/32, although the chart itself cannot be verified from the audio transcript alone.
ICT OTE Volume 18 Five-Minute Setup
After inviting viewers to pause and inspect the lower-time-frame chart, ICT adds his annotations at 1:57. During the New York session, he identifies another high-to-low move and a retracement into the OTE area.
ICT describes the model as using the 62% retracement level for a hypothetical short entry. The automated transcript represents the quoted bond price as “177 and 20 30 seconds,” which most likely refers to 177 and 20/32, but that notation should be checked against the original chart before being relied upon.
An important qualification appears at 2:18: ICT explains that the annotation does not itself establish where a trader would have been filled. He points to a later candle as the assumed fill and says the next candle moved two ticks against the position.
ICT OTE Risk and Target Framework
- Illustrative adverse movement: two ticks.
- Tick value stated in the video: $31.25 per contract.
- Illustrative drawdown: $62.50 per contract.
- Model stop: six ticks.
- Nearby objectives: relative equal lows and the June 1 daily low.
- Extended objective: a level ICT calls two standard deviations.
These figures summarize ICT’s retrospective chart explanation. The transcript cannot independently confirm an order, fill, stop execution or realized result.
How ICT Explains the OTE Example
At 3:03, ICT points to the prior day’s low (the June 1 daily low) and notes that the five-minute chart created an OTE, with the model looking for movement below that level.
At 3:15, he reports a 29-tick move, expressed as $906.25 for one contract, to the model’s two-standard-deviation objective. He also discusses leaving part of a position open for a larger continuation and cites a move worth more than $1,650 per contract.
Those amounts are the speaker’s account of the annotated example, not independently verified trade performance. The source does not reveal brokerage records, actual fills or whether any live position was taken.
ICT OTE Volume 18 Educational Takeaways
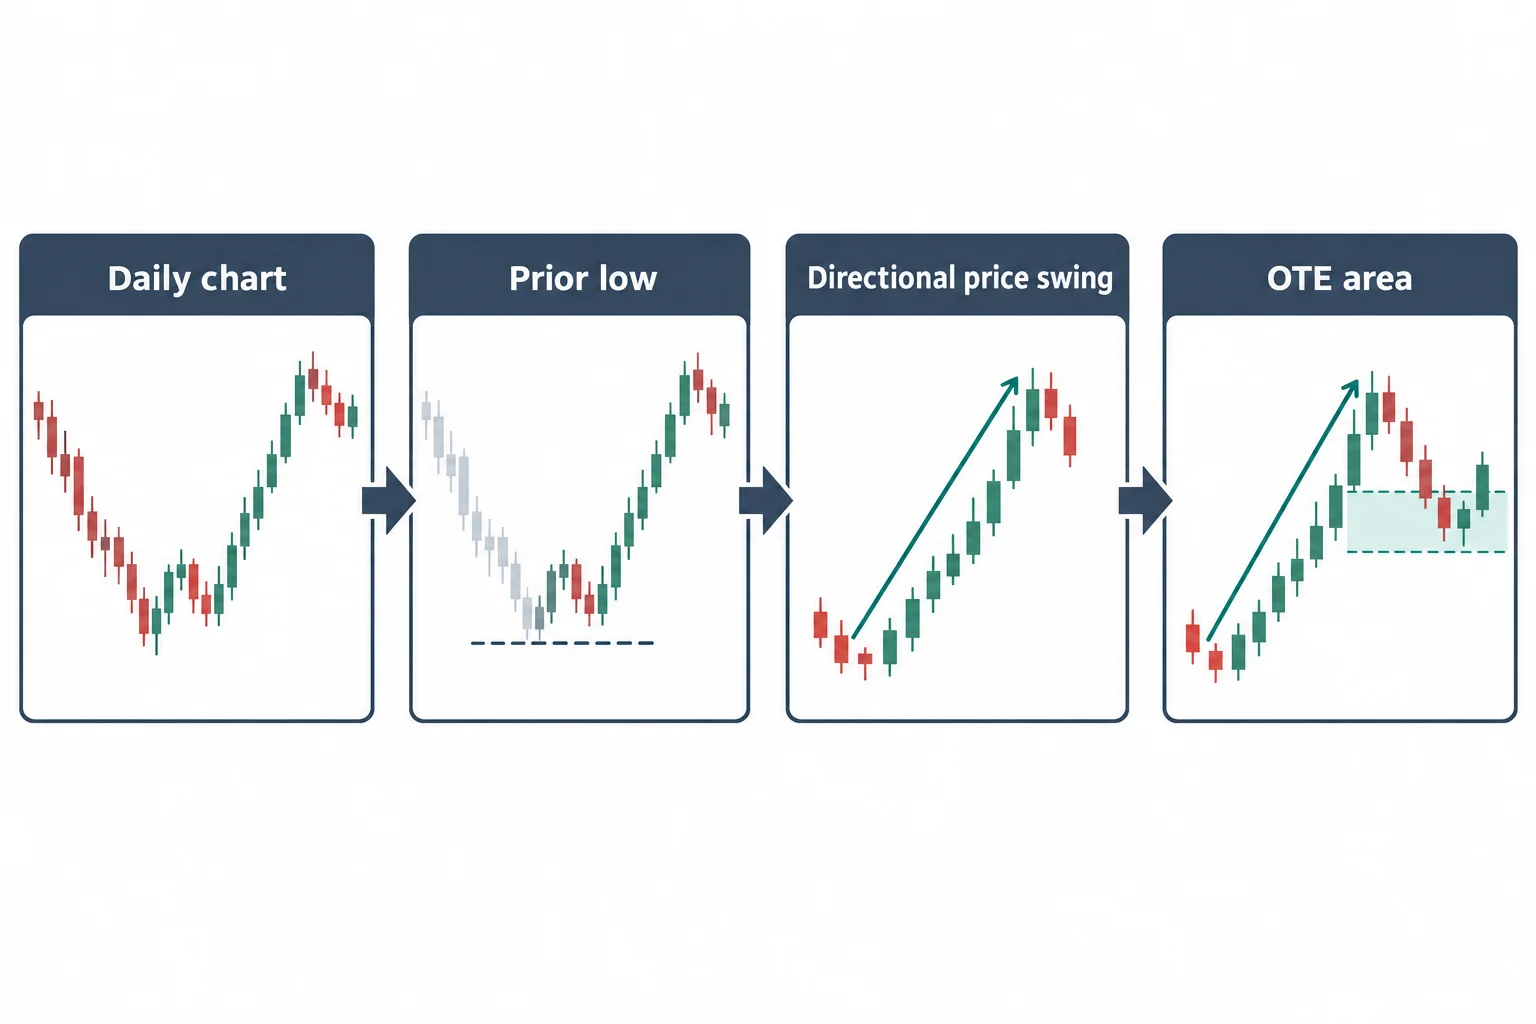
The broader pattern-recognition exercise can be understood as a top-down sequence:
- Use the daily chart to form a directional hypothesis.
- Mark a prior low and any nearby cluster of similar lows.
- Move to a lower time frame and identify a directional price swing.
- Observe whether price retraces into the OTE area, with emphasis here on the 62% level.
- Define the assumed entry, invalidation distance and objectives before evaluating the example.
This is an explanation of ICT’s framework, not proof that OTE setups have a reliable trading edge. His closing praise for Treasury Bond futures (and comparisons with forex, index futures and crypto) should likewise be read as personal market commentary. The video supplies one selected historical example, not a systematic test across different periods or market conditions.
This material is educational commentary on the cited source and is not investment advice or a promise of results.
Related Resources
ICT’s OTE framework is one trader’s personal method. The following general educational references cover the underlying concepts and are not endorsements of any specific approach.
- Treasury Bond Futures: Definition, Specifications, and Trading [10] — an overview of Treasury Bond futures contracts, including delivery months, tick size and contract specifications.
- Futures Trading: How It Works, Contracts, and Risks [11] — a general introduction to futures markets, margin, leverage and the risks involved.
- Risk/Reward Ratio: Definition, Formula, and Examples [12] — an explanation of how traders define and measure risk relative to potential reward.




