
Key takeaways
ICT’s OTE Pattern Recognition Series episode 14 uses GBP on a five-minute chart to teach bearish Optimal Trade Entry swing selection during the New York window from eight thirty a.m.
Read the full summary
ICT’s OTE Pattern Recognition Series episode 14 uses GBP on a five-minute chart to teach bearish Optimal Trade Entry swing selection during the New York window from eight thirty a.m. to eleven a.m., favoring a clear swing high, lower highs and forceful downswing over choppy consolidation before measuring high to low with Fibonacci. The hypothetical setup uses a 62% retracement near 1.2268, a 20-pip stop, seven pips of drawdown and objectives of about 20, 40 and 60 pips, with the largest illustrating roughly 3 to 1 reward to risk near a move through the previous day’s low. ICT prefers 62% for learners because waiting for 70.5% or 79% may miss an entry and spreads can affect fills, while stressing that Fibonacci describes a retracement rather than causing price movement. Directional bias remains separate and is not reduced to a mechanical rule, so ICT recommends uncluttered charts, screenshots, annotations and repeated comparison of market signatures. The lesson is episode 14 of a planned 20-video series, but the automatic transcript lacks the chart, does not verify fills or outcomes, and provides no testing data supporting claims of daily occurrence or high strike rates.
How we researched this article
BestProps used document-based research from primary firm sources, checked September 25, 2026. The complete source list, scope, limitations, and commercial-state record appear near the end of this article.
In OTE Pattern Recognition Series – Vol. 14, ICT walks through a British pound example on a five-minute chart. The lesson focuses on selecting the price leg used to frame a bearish Optimal Trade Entry (OTE), rather than mechanically applying Fibonacci levels to every visible swing.
The discussion is an interpretation of one chart example, not proof that the setup has a repeatable trading edge. Because the transcript was produced by automatic speech recognition and does not include the chart itself, visual details such as candle locations and plotted levels cannot be independently confirmed here.
ICT OTE Pattern Recognition Session Window
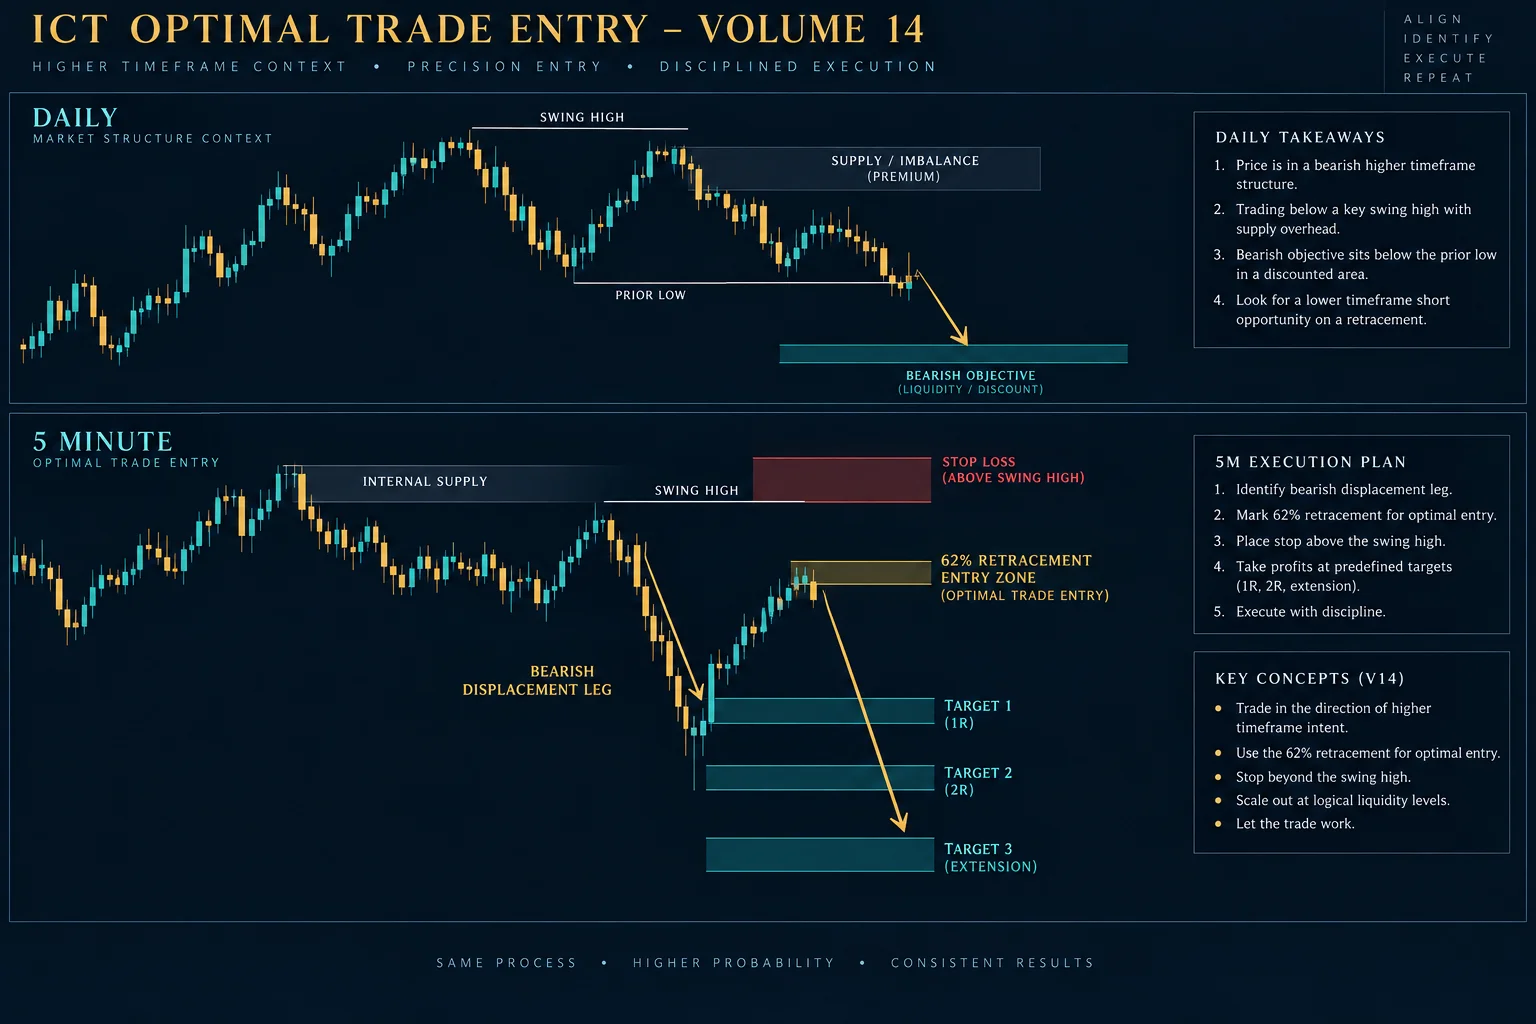
ICT introduces this as episode 14 of a planned 20-video pattern-recognition series and identifies the example as the British pound on a five-minute chart. He first asks viewers to pause and inspect the unannotated chart before seeing his markings. This exercise begins at 0:22.
At 0:41, he defines the model’s New York-session study window as 8:30 a.m. to 11:00 a.m. New York time. His task within that window is to identify a clear swing suggesting that price is pressing lower.
He also recommends studying relatively uncluttered price charts. In his view, indicators and moving averages can distract from the swing structure, candle behavior and time window being examined. That is a teaching preference specific to ICT’s price-action framework, not a demonstrated finding that indicators are inherently ineffective.
How ICT Selects the Bearish OTE Price Leg
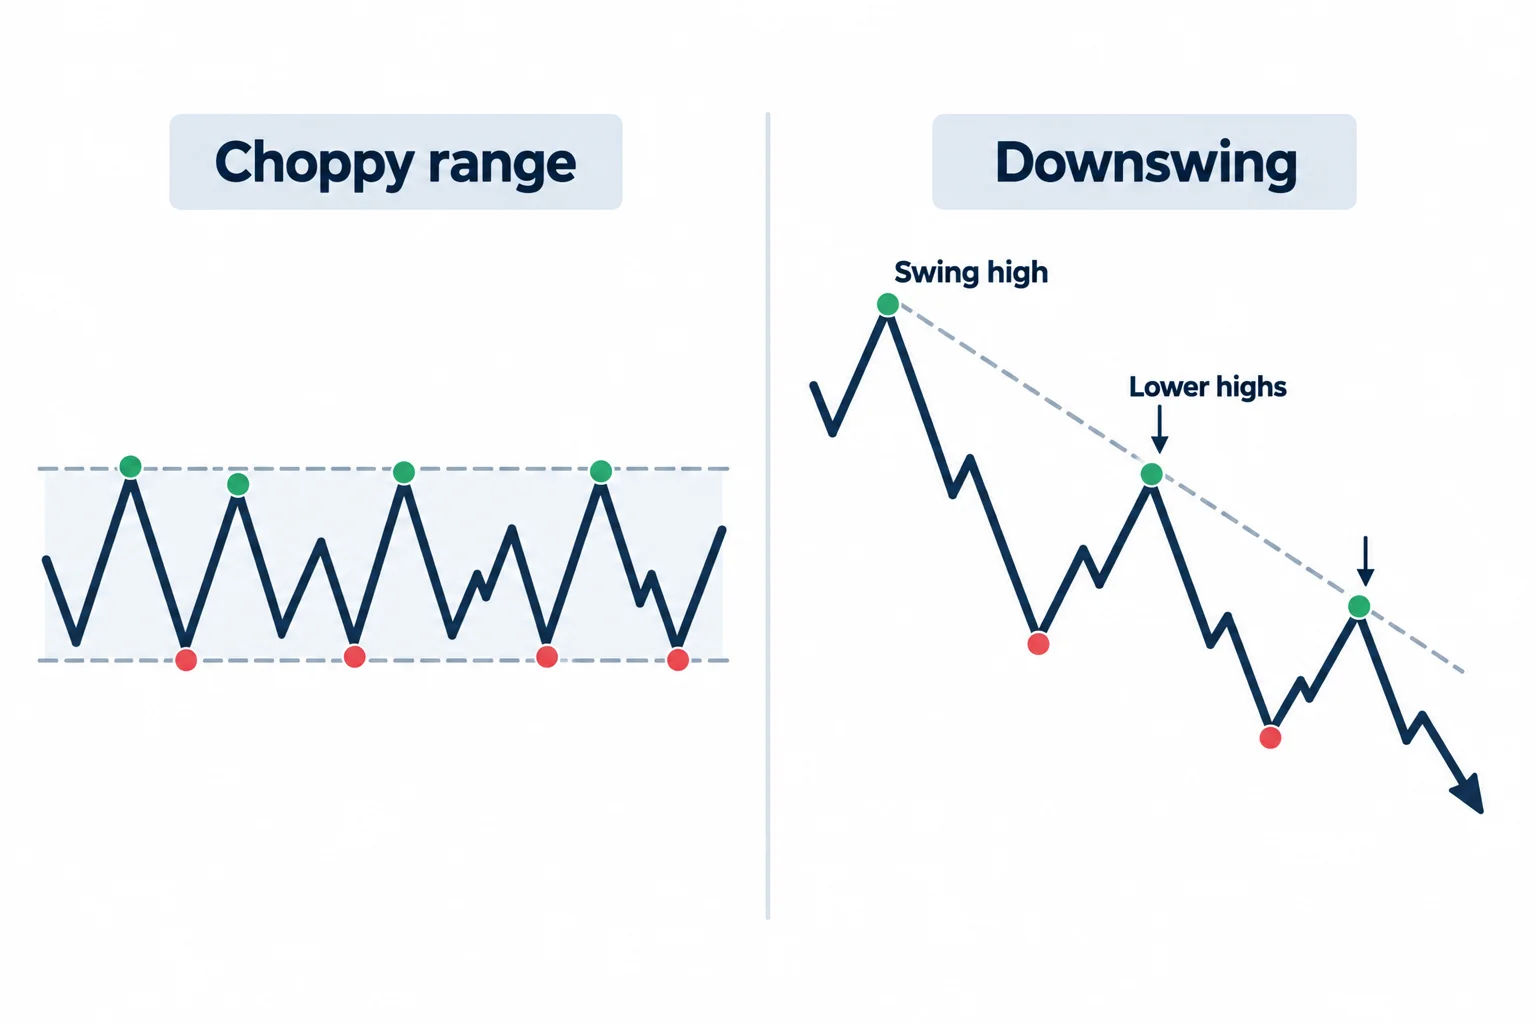
The central lesson starts around 2:12. ICT contrasts a choppy area, containing substantial back-and-forth movement, with a cleaner downswing. He favors the latter because he interprets it as showing a more decisive willingness to move lower.
The characteristics he highlights include:
- A visible swing high followed by lower highs to its right.
- A relatively clear and forceful move lower.
- Less ambiguity than the neighboring consolidation or trading range.
- A price leg that can be measured from its high to its low.
ICT calls this recurring combination a market “signature.” At 3:23, he explains that a signature is a price-action characteristic a trader studies across repeated examples. His broader objective for the series is to train visual recognition through comparison and chart review.
He further connects directional context with potential movement below the previous day’s low or above the previous day’s high. However, this episode does not provide a complete, mechanical procedure for determining directional bias. ICT later emphasizes that bias requires other lessons and regular study.
How Fibonacci Supports ICT OTE Pattern Recognition
Once the downswing is selected, ICT applies a Fibonacci retracement from the swing high to the swing low. At 4:34, he explicitly says the Fibonacci tool is not the reason price moves. Instead, he uses it to describe where a retracement sits within the selected range.
In this bearish example, a return toward the upper part of the range is characterized as short-term overbought relative to that swing. The lower projection levels are presented only as rough estimates of how far a decline might extend. ICT then relates those projections to the previous day’s low.
At 5:30, ICT discusses the 62% retracement as the standard hypothetical entry used in this series. The transcript recognizes the example entry as approximately 1.2268, followed by wording that sounds like “one pipette”; that final phrase is ambiguous and should be checked against the video. He pairs the example with a hypothetical 20-pip stop above the referenced high and reports seven pips of drawdown.
He contrasts the 62% level with deeper 70.5% and 79% retracements. His stated reason for favoring 62% while learning is practical: waiting for a deeper retracement may result in no entry, and the spread may also affect whether an order is filled. These are ICT’s instructional preferences within the model, not universal execution rules.
ICT OTE Pattern Objectives in Volume 14
From 6:24, ICT describes several hypothetical distances:
- About 20 pips near the prior short-term low.
- About 40 pips at what he calls one-half of a standard deviation.
- About 60 pips near a run through the previous day’s low.
He summarizes the largest of these illustrations as roughly three units of reward for one unit of risk. These figures come from his narration of the chart; the transcript alone cannot verify the plotted prices, whether an order actually filled, or the outcome of any live trade. The phrase “standard deviation” appears to refer to a chart projection in his framework, but its exact construction is not explained in this episode.
Why ICT Pattern Recognition Is Not Directional Bias
Near 7:20, ICT identifies directional bias (deciding whether to look for a purchase or a sale) as the difficult part. He does not reduce that decision to a single rule. Instead, he recommends daily chart study, screenshots and personal annotations to build familiarity with the pattern.
ICT also makes strong claims in the recording about the pattern appearing every day and about high strike-rate methods. No testing data are supplied in the transcript, so those statements should be treated as the speaker’s market interpretation rather than established performance evidence.
ICT OTE Pattern Recognition Takeaways
Independent of ICT’s specific terminology, the lesson demonstrates a useful study process: define a time window, compare cleaner directional movement with congestion, state why one swing was selected, and save annotated examples for later review. It also shows why a retracement measurement depends on swing selection; changing the anchors changes every resulting level.
This material is educational and does not constitute investment advice. Historical chart narration, hypothetical entries and projected pip distances do not establish future results.




