
Key takeaways
ICT Volume 11, the eleventh lesson in a 20-video Optimal Trade Entry Pattern Recognition Series, analyzes a five-minute USD/CAD setup using Wednesday’s high, a New York session push above and return below that prior-day level, and a selected bullish swing retracing 62% for entry with a standard 15-pip stop below the swing low.
Read the full summary
ICT Volume 11, the eleventh lesson in a 20-video Optimal Trade Entry Pattern Recognition Series, analyzes a five-minute USD/CAD setup using Wednesday’s high, a New York session push above and return below that prior-day level, and a selected bullish swing retracing 62% for entry with a standard 15-pip stop below the swing low. Projected targets are 20 pips at one-half standard deviation, 30 pips at one standard deviation, 40 pips at one-and-a-half standard deviations, and more than 50 pips near or beyond two standard deviations, which ICT treats as the rule-based profit objective rather than attempting to capture the exact extreme. The automatic transcript’s quoted entry and stop prices are unreliable without checking the original May 21, 2020 video, and the retrospective chart example does not verify fills, spread, slippage, realized profit, or a statistical edge.
How we researched this article
BestProps used document-based research from primary firm sources, checked September 25, 2026. The complete source list, scope, limitations, and commercial-state record appear near the end of this article.
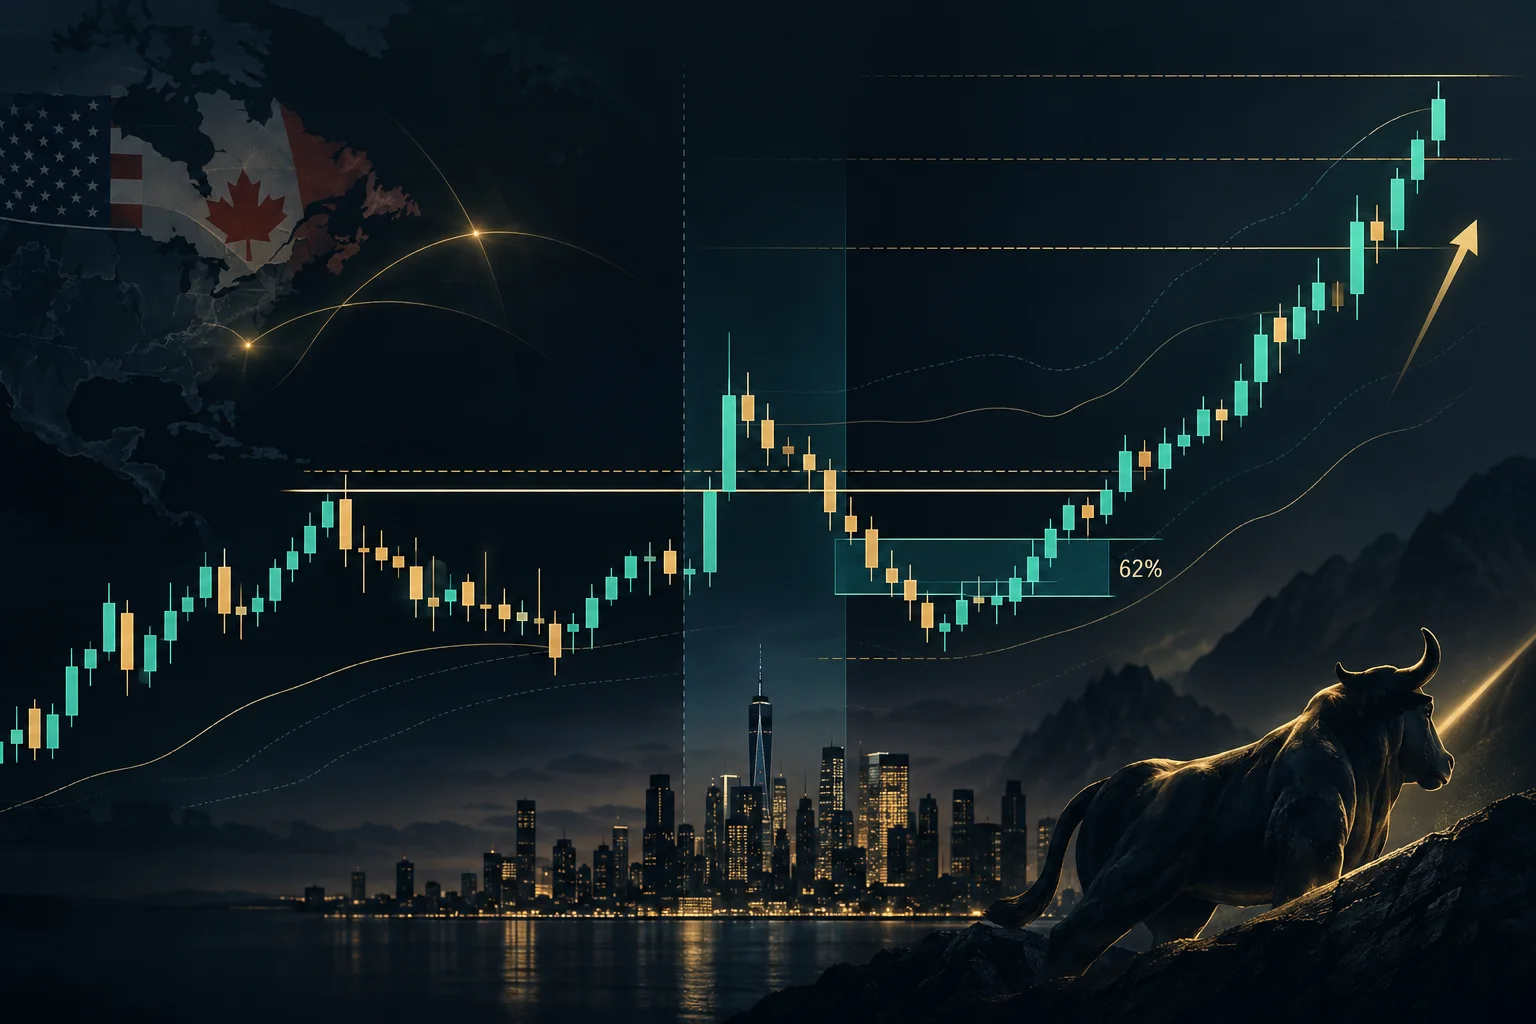
Volume 11 of ICT’s Optimal Trade Entry Pattern Recognition Series presents a brief annotated example on a five-minute USD/CAD chart. ICT uses the example to connect three elements: a previous daily high, a New York session move through that high, and a Fibonacci retracement described as an Optimal Trade Entry, or OTE.
The lesson is based on OTE Pattern Recognition Series – Vol. 11, uploaded on May 21, 2020. Because the available transcript was generated automatically and the chart itself cannot be inspected here, spoken price figures and visually dependent details should be checked against the original video.
ICT Pattern Recognition Chart Exercise
At 0:10, ICT identifies this as the eleventh installment in a 20-video pattern-recognition series. The example uses a five-minute dollar/Canadian dollar chart. As in the surrounding lessons, viewers are invited to pause before the annotations appear and independently study the setup.
This pause-and-review format matters educationally. Rather than merely seeing a completed diagram, the viewer can first look for the relevant swing, time of day, and prior-session reference levels. The annotations are then introduced as a comparison with ICT’s own reading, not as proof that every similar formation will behave the same way.
ICT Pattern Recognition With Previous Highs and New York Timing
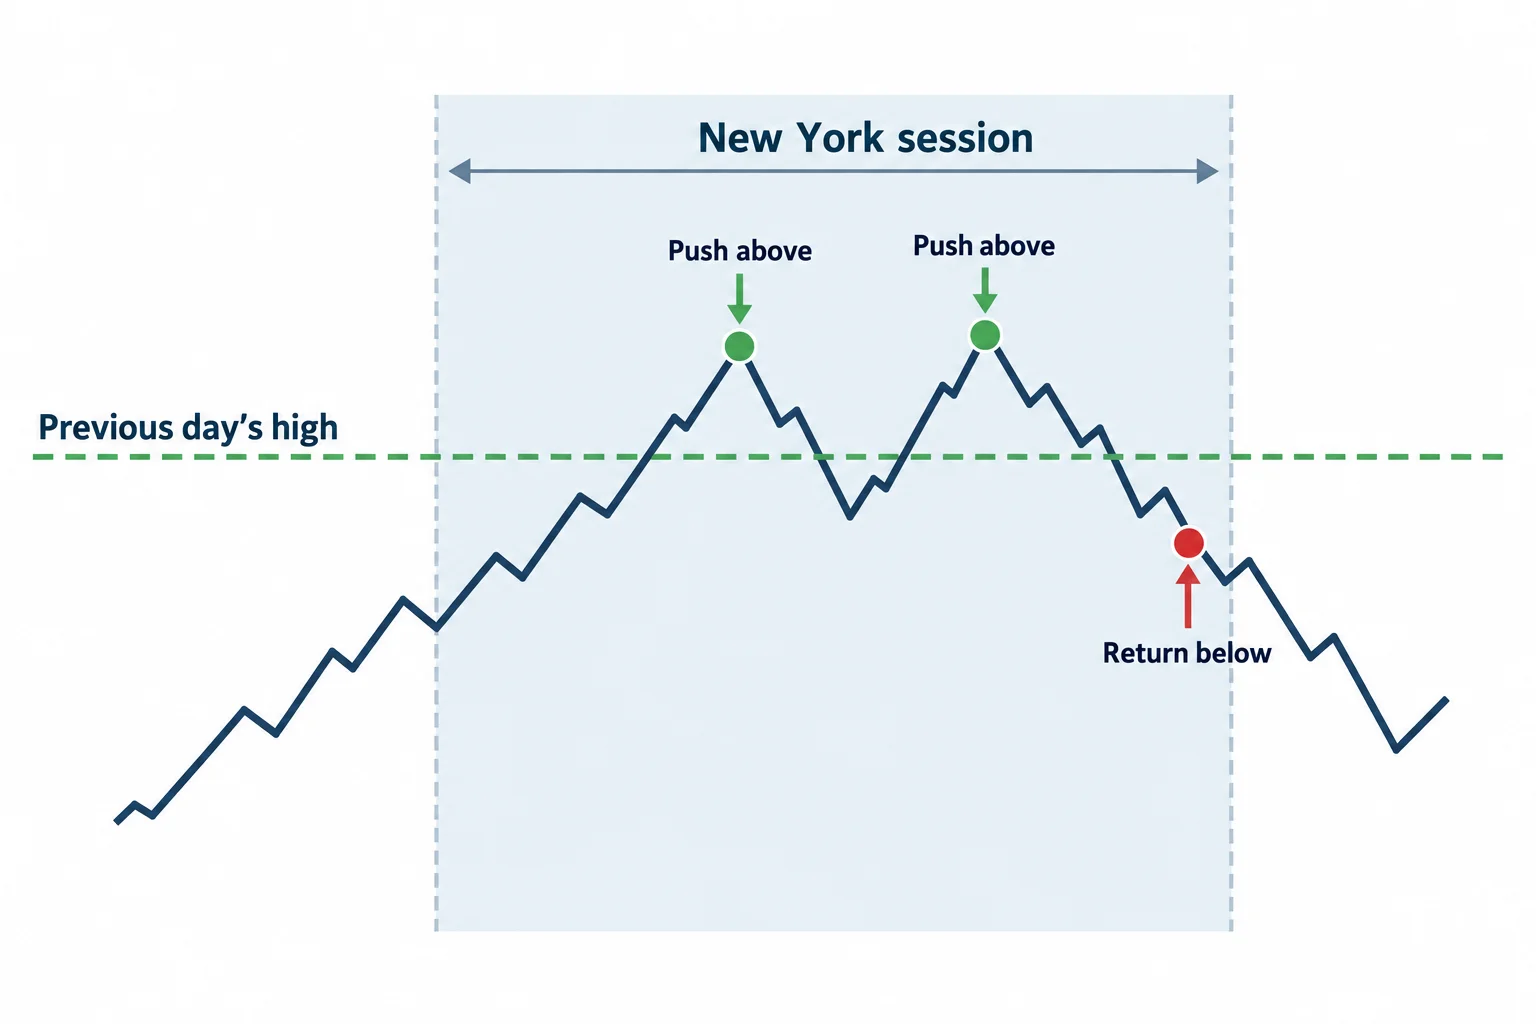
Beginning around 0:35, ICT marks the time of day and Wednesday’s daily high, which he also calls the previous day’s high. He describes price running above that level during the New York session before moving back beneath it.
In ICT’s interpretation, the prior high sets the context for the example. The sequence he highlights is broadly:
- Identify the previous day’s high.
- Observe a New York session move above that reference.
- Note a further push above it and a return below.
- Use a selected price swing to frame a retracement entry.
The transcript supports this sequence, but it does not establish the exact session date or allow independent confirmation of the candles. The upload date should not be assumed to be the date of the shown trading session.
How ICT Frames the OTE Pattern
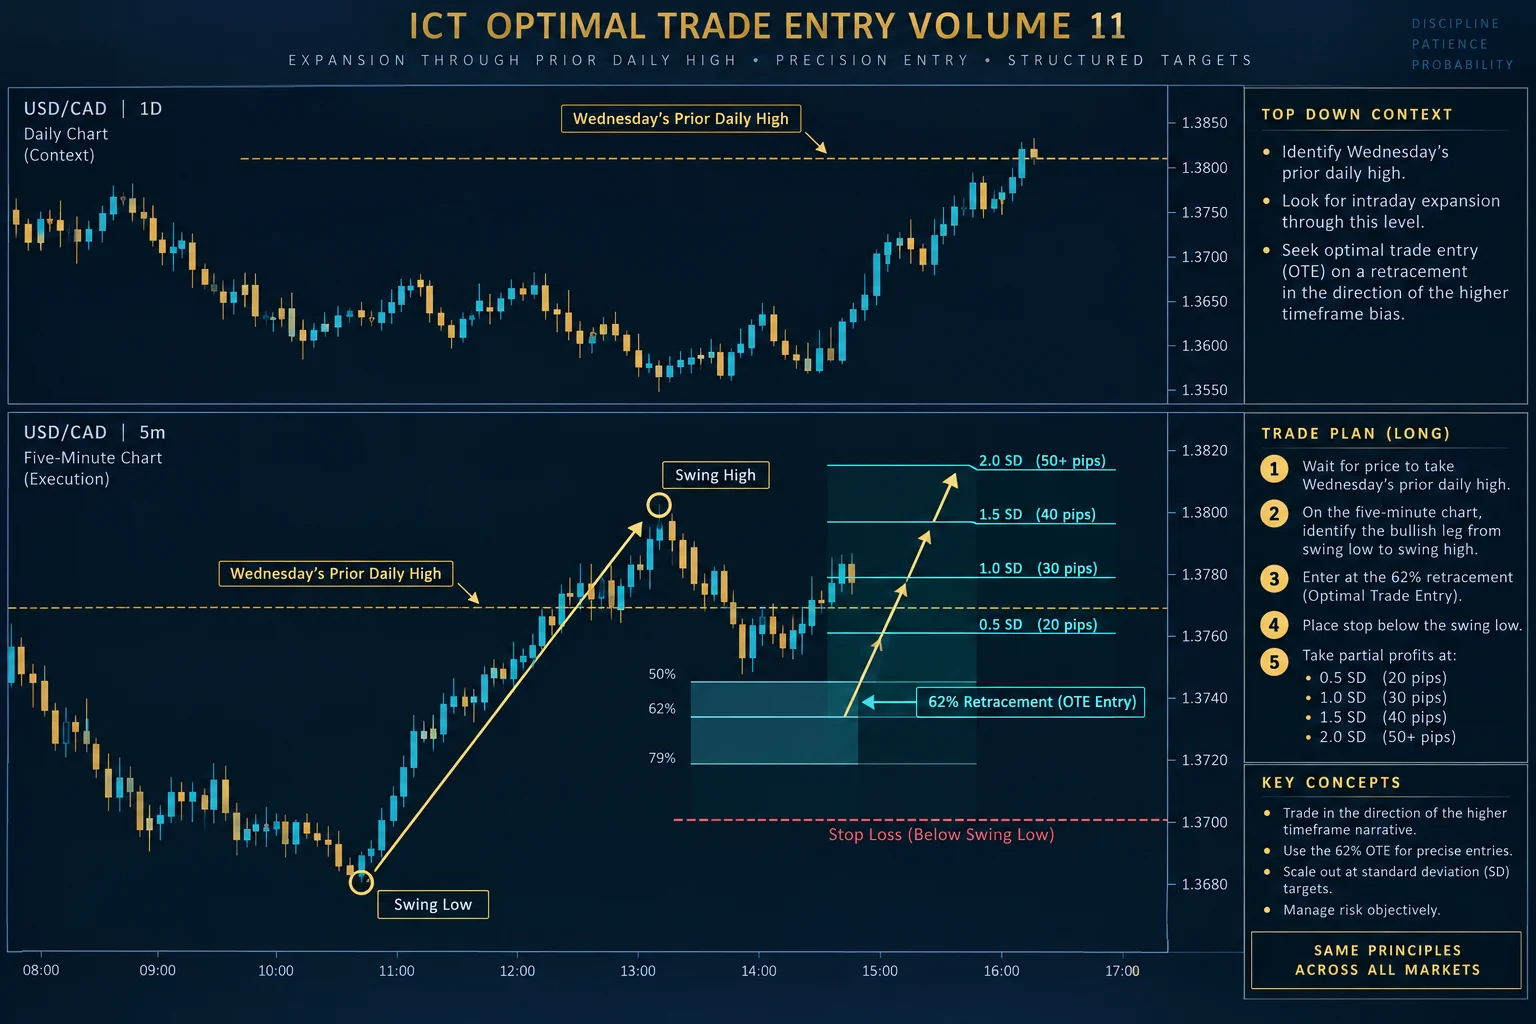
At 0:53, ICT identifies the retracement area he regards as the OTE. He briefly notes that another nearby low-to-high swing could also be used, then selects one swing for the displayed Fibonacci measurement.
At 1:04, he introduces the Fibonacci annotations and points to the 62% retracement as the entry level in this example. The automatic transcript renders the spoken entry as “1.3903 and two pipettes” and the stop reference as “138951.” These figures are not sufficiently reliable without checking the chart: the latter may be missing punctuation, while “pipettes” may refer to fractional pips. The robust teaching point is therefore the relative structure (a 62% retracement with a stop below the referenced swing), not an unverified exact quote.
OTE Pattern Stops and Volume 11 Targets
ICT then discusses a standard 15-pip stop and says USD/CAD may carry a somewhat wider spread. From approximately 1:21, he maps projected movement to standard-deviation intervals:
- 20 pips at one-half standard deviation;
- 30 pips at one standard deviation;
- 40 pips at one-and-a-half standard deviations;
- two standard deviations as the model’s profit-taking objective.
ICT says the illustrated move extended slightly beyond the two-standard-deviation level, but argues that the model is intended to be rule-based rather than to capture the exact extreme. He characterizes the example as producing more than 50 pips relative to a 15-pip stop. This is the speaker’s retrospective interpretation of the displayed chart; the transcript alone does not verify an actual order, fill, spread, slippage, or realized result.
ICT OTE Pattern Recognition Lesson
Near 2:01, ICT returns to the behavior around Wednesday’s high: an initial spike through it, another drive higher, and then movement back below the level. He concludes by emphasizing prior-day highs and lows as recurring reference points for finding setups.
A practical study method is to separate the lesson into context, trigger, and management. Context is the prior daily high and New York timing. The trigger is ICT’s selected Fibonacci retracement after the move around that high. Management consists of the stop beneath the selected structural point and predefined deviation-based objectives. This classification is a general educational interpretation of the presentation, not a claim that the pattern has a verified statistical edge.
Historical chart examples can make a framework easier to recognize, but they do not demonstrate future profitability. Traders reviewing the lesson should verify the chart annotations in the 0:35 and treat the material as education rather than investment advice.





