
How we researched this article
BestProps used document-based research from primary firm sources, checked September 25, 2026. The complete source list, scope, limitations, and commercial-state record appear near the end of this article.
Volume 6 of ICT’s Optimal Trade Entry Pattern Recognition Series uses a historical crude-oil example to connect three ideas: directional bias, liquidity above prior highs, and a New York session retracement into an OTE zone. Rather than treating a single candlestick as a complete signal, ICT argues that it should be interpreted within a broader market narrative.
Watch the primary video: “OTE Pattern Recognition Series – Vol. 06”.
The daily-chart question
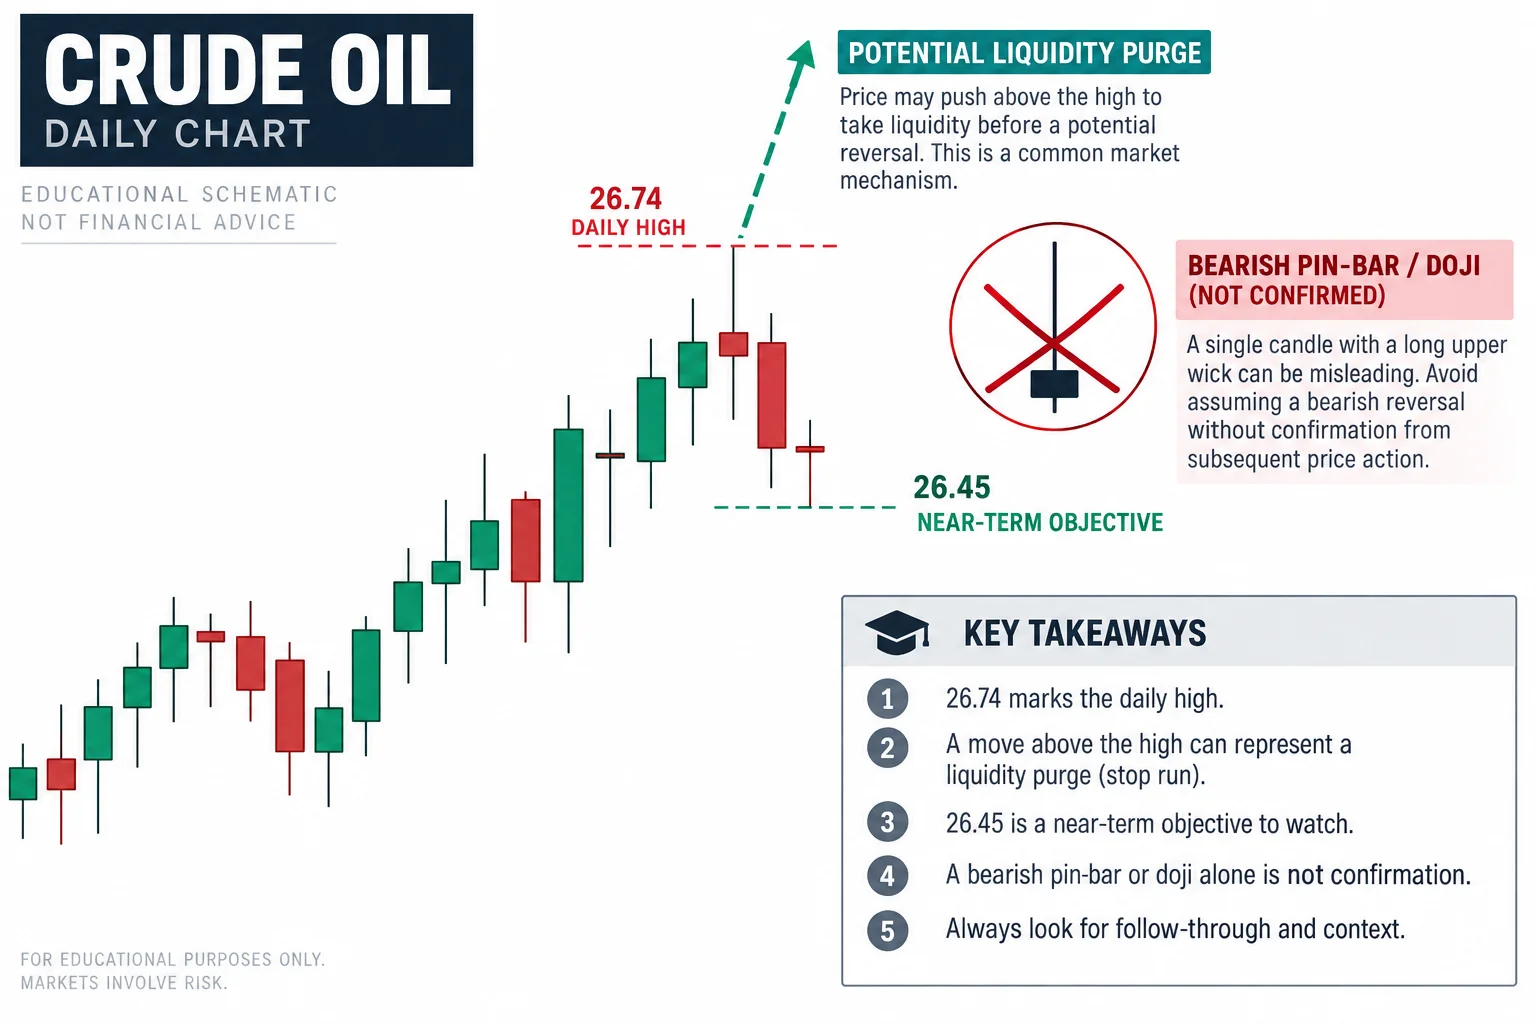
ICT opens the lesson on a daily crude-oil chart and asks whether price is more likely to run above a selected candle’s high or below its low. At 0:33, he frames this as a directional-bias exercise rather than immediately looking for an entry.
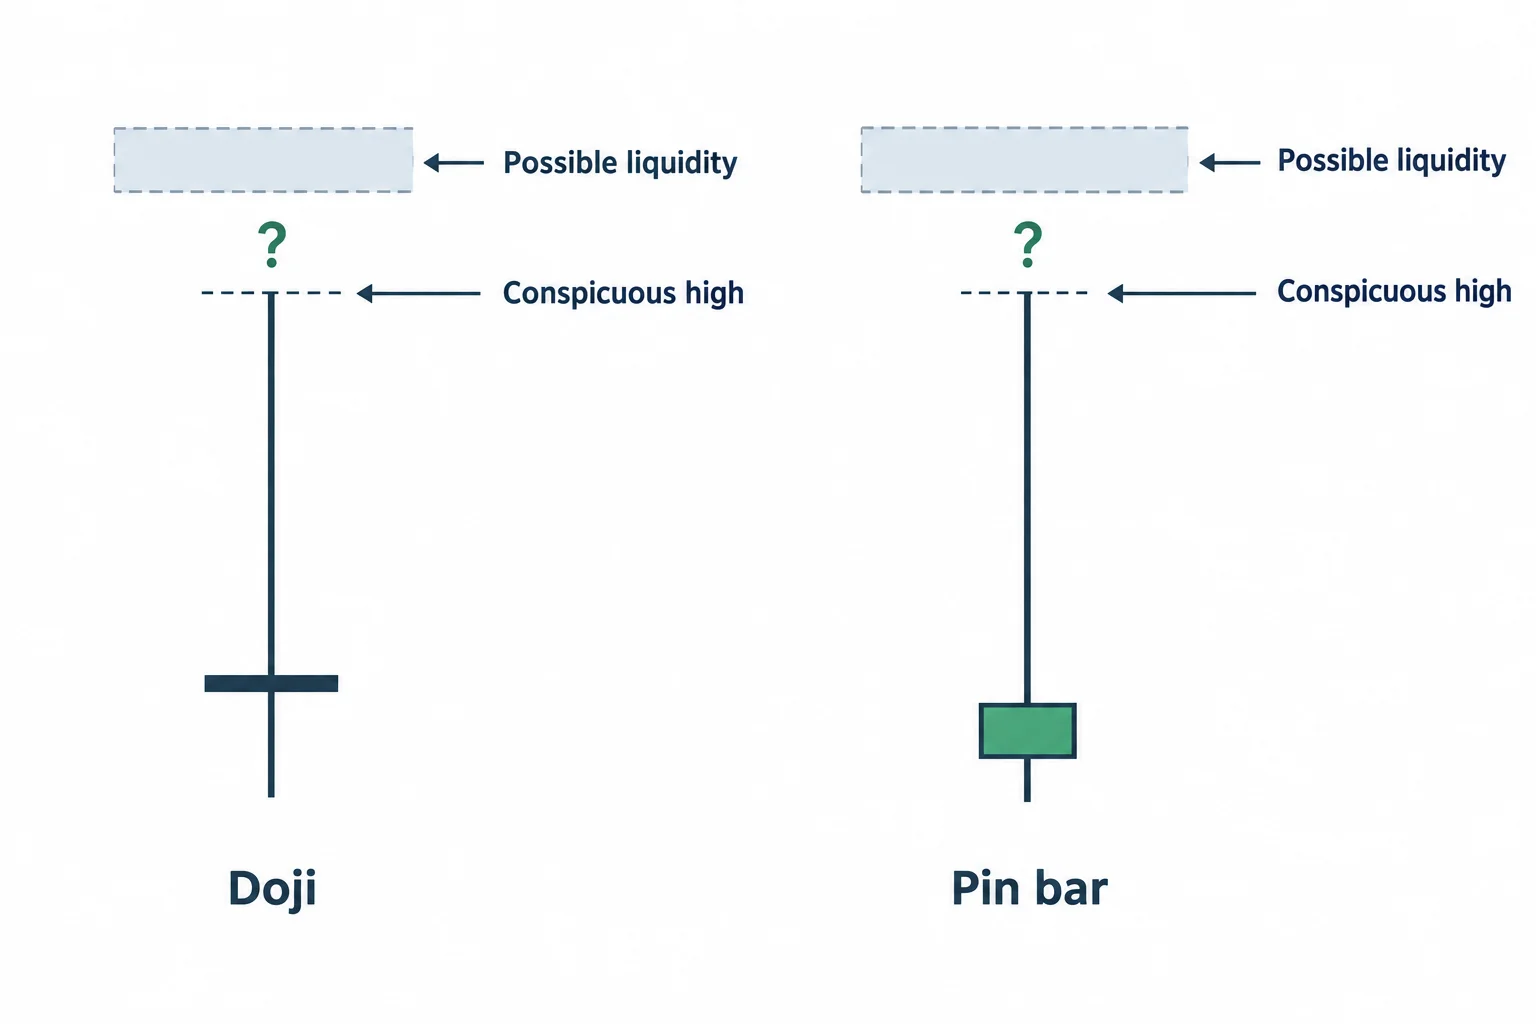
The candle under discussion resembles what traders might call a doji or pin bar. ICT says that a conventional bearish reading could encourage traders to interpret it as a market top. His preferred interpretation in this example is different: the conspicuous high may attract price because orders and stops can be clustered above it.
At 1:05, ICT explains that he likes to see these recognizable highs “purged”—his terminology for price trading through a level where liquidity may be resting. This is presented as ICT’s market interpretation, not proof that pin bars or dojis reliably fail.
Using liquidity to form a directional bias
ICT identifies two historical chart levels in the recording. The first is a nearby candle high at 26.45, while the more significant high associated with the earlier candle is stated as 26.74. Beginning around 2:27, he describes 26.45 as a near-term objective and 26.74 as the level he is more interested in seeing price approach.
Importantly, he does not say that the upper level must be reached on the next trading day. He calls it a “draw on liquidity,” meaning a reference point used to establish directional expectations. In this framework, the anticipated destination helps determine whether an intraday retracement might be considered for a bullish setup.
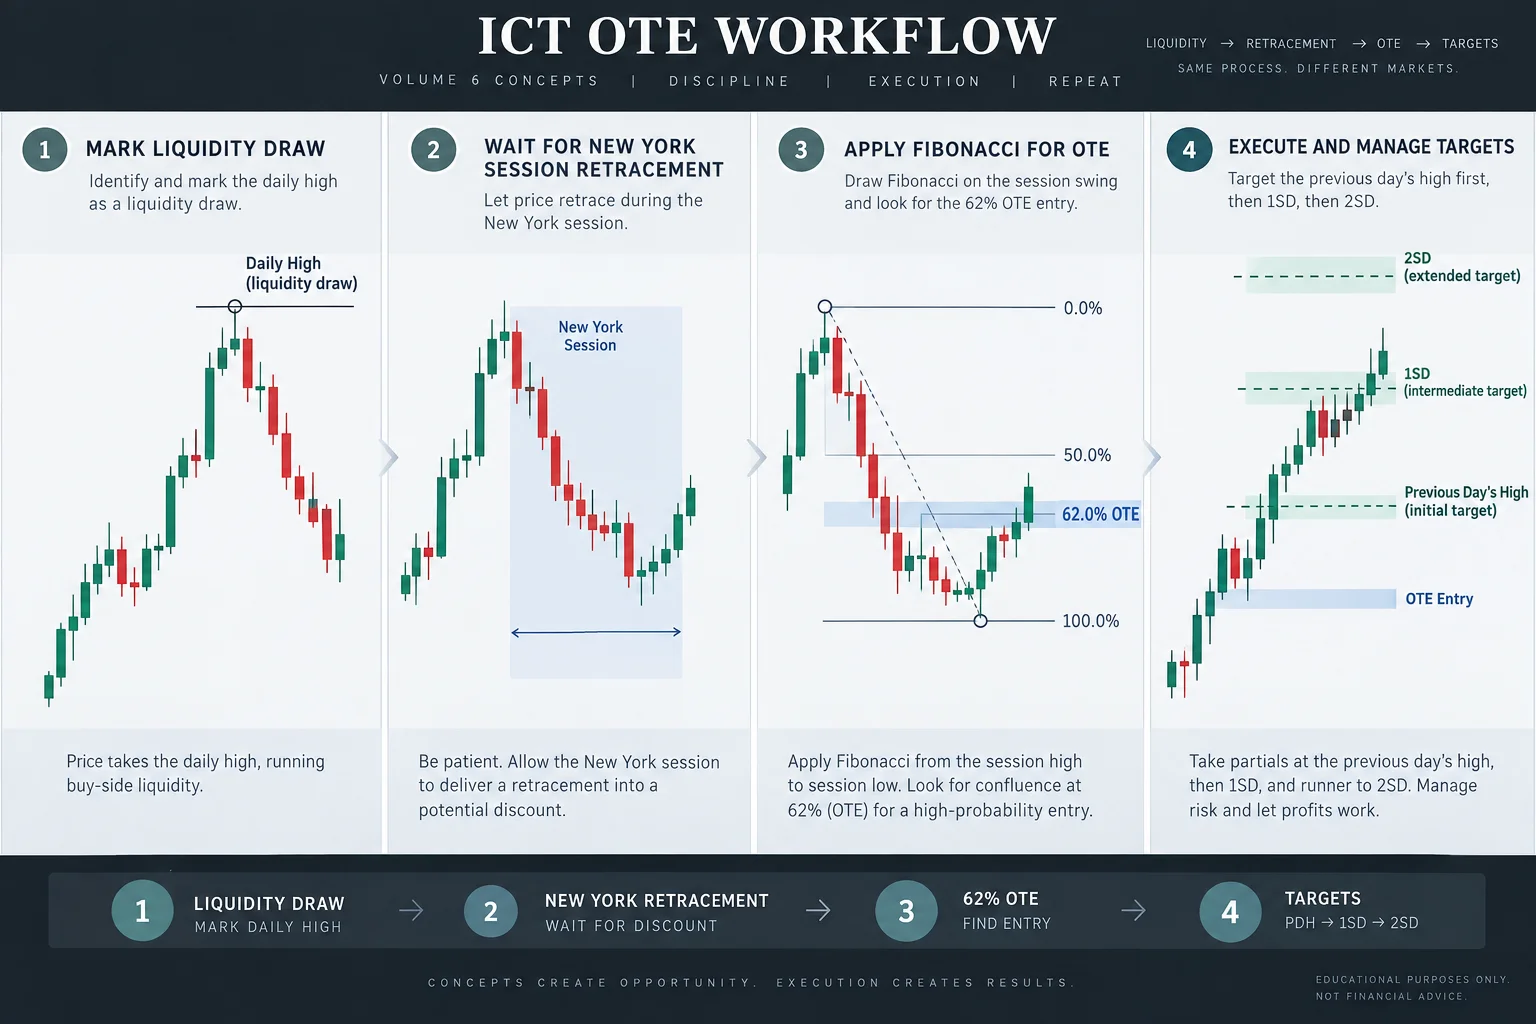
The broader lesson is that bias and execution are separate decisions:
- Bias: Identify a plausible external objective, such as a prior daily high or low.
- Timing: Wait for the session in which the setup is expected to develop.
- Entry: Look for a retracement rather than chasing the initial move.
- Exit: Use predefined objectives rather than assuming an unlimited continuation.
Why getting the daily direction right is not enough
At 2:58, ICT addresses a common belief that accurate daily bias automatically leads to profitable trading. He disputes that conclusion. In his view, excessive emphasis on being right every day may encourage overtrading and revenge trading after a loss.
This risk-management warning is one of the more broadly applicable parts of the lesson. A directional thesis does not specify entry quality, position size, invalidation, transaction costs, or trader discipline. Even if a market eventually reaches the anticipated objective, an individual execution can still fail before that happens.
The five-minute OTE example
ICT then moves to a five-minute chart of the June 2020 crude-oil contract. He notes that price had already moved slightly above the previous day’s high, but characterizes that move as shallow. He retains 26.74 as the higher daily-chart reference and looks for a deeper run above the prior-day high.
At 4:31, ICT explains that price traded to 26.75, just beyond the marked 26.74 level, and then rejected. He subsequently applies a Fibonacci tool to the New York session swing.
The retracement reaches what he calls the Optimal Trade Entry area, specifically the 62% retracement. At 5:17, he gives 25.91 as the illustrative entry. He also discusses a protective level below the local low and describes the example as carrying 32 points, or approximately $320 per contract, of risk. The generated captions are unclear about the exact stop-price wording, so that value should be checked against the chart rather than reconstructed from the transcript.
Objectives in the example
The first objective is the previous day’s high. ICT then discusses a one-standard-deviation projection near 26.75 and a further objective at 27.28. According to his narration, the chart later reaches the second standard-deviation level, where the illustrated trade would be closed. That is a description of the chart shown in the lesson, not independent evidence of an actual fill or verified trading result.
Educational interpretation
The example can be summarized as a top-down process: identify a higher-time-frame liquidity objective, use that objective to form a directional hypothesis, wait for a New York session retracement, and map the retracement with ICT’s OTE framework. The prior high supplies the destination, while the Fibonacci retracement supplies a possible execution area.
This does not establish that the pattern has a repeatable statistical edge. The video presents one selected historical example and does not provide a tested sample, comparison group, or complete record of trades. Candlestick labels, liquidity concepts, Fibonacci levels, and standard-deviation projections should therefore be understood as components of ICT’s educational methodology rather than guaranteed predictors.
The clearest practical takeaway is procedural: avoid making a decision from a candlestick shape alone, define the intended destination and invalidation before entry, and do not confuse a directional opinion with a complete risk plan. This article is educational commentary and not investment advice.
Watch the lesson
If the embed does not play, watch on YouTube.




