
How we researched this article
BestProps used document-based research from primary firm sources, checked September 25, 2026. The complete source list, scope, limitations, and commercial-state record appear near the end of this article.
In OTE Pattern Recognition Series – Vol. 05, ICT presents a short bearish Optimal Trade Entry example using the June 2020 E-mini S&P 500 futures contract. The lesson is based on a May 13, 2020 market example and moves from hourly directional context to a five-minute execution framework.
The central teaching is that the retracement tool does not create the trade premise. In ICT’s interpretation, the premise begins with bearish market structure and liquidity resting below the prior day’s low. The retracement and range projections are then used to organize a hypothetical entry and partial-profit levels.
ICT OTE Bearish Pattern Context
At 0:20, ICT identifies the instrument as the June 2020 E-mini S&P contract. He briefly refers to an earlier idea involving the previous Friday’s high, but says that idea was complete once price returned to the level. The video does not independently document an executed trade or establish what fills a trader could have received.
For the new example, ICT characterizes the higher-time-frame structure as bearish. At 1:04, he marks the low from May 12 as the objective and then shifts from the hourly chart to a five-minute chart.
This top-down sequence is an important part of the lesson:
- Determine a directional view from the higher-time-frame structure.
- Identify an external reference point, in this case, the previous day’s low.
- Move to a lower time frame to study a retracement within the relevant session.
- Use the dealing range to frame a theoretical entry, invalidation point, and projected objectives.
ICT OTE Five-Minute Pattern Setup
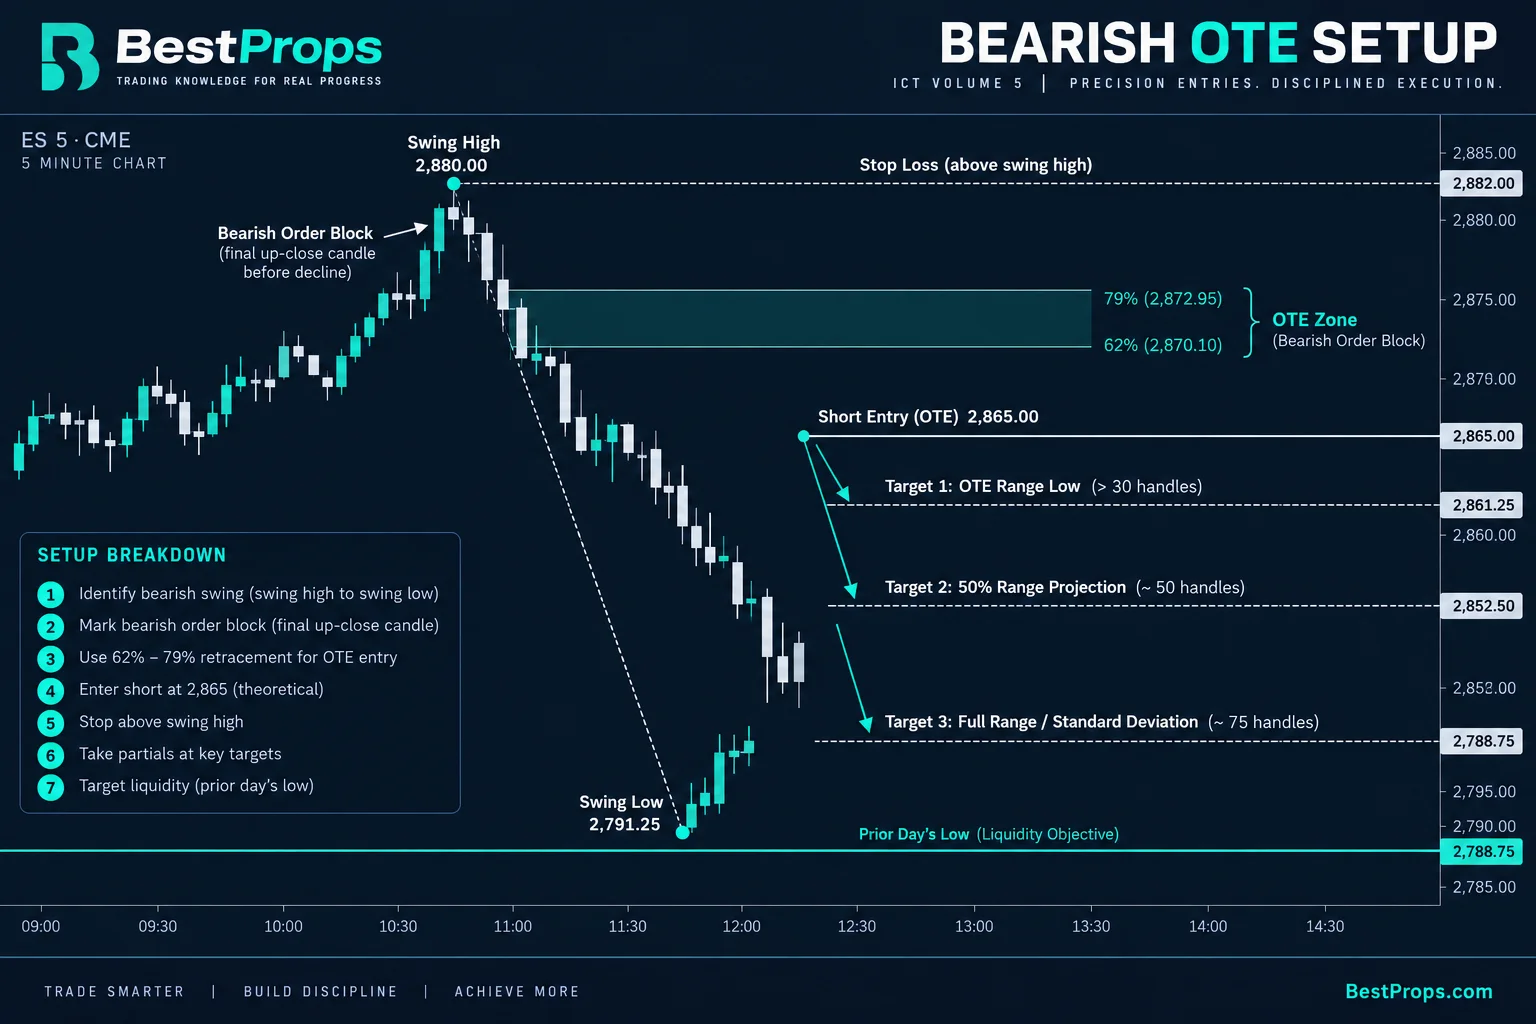
Beginning at 1:15, ICT focuses on the five-minute chart and the New York session. He describes price making a high, trading down to a low, and then retracing. That retracement enters what he calls a bearish order block, defined in this example as the final up-close candle before the decline.
ICT gives 2865 as a theoretical entry and places the hypothetical stop above the referenced high. These figures belong to the historical chart illustration; the captions do not provide enough information to verify actual order execution, slippage, commissions, or a realized result.
OTE Projected Levels and Profit Targets
At 2:06, ICT explains that because the example concerns the S&P futures contract, he discusses the movement in handles rather than pips. He outlines three theoretical partial objectives:
- The low associated with the OTE range, described as offering more than 30 handles from the stated entry.
- A second partial at approximately 50 handles, associated with a half-range projection.
- A third partial near 2788.75, described as a full-range or standard-deviation projection and approximately 75 handles from the theoretical entry.
The terminology around “standard deviation” is used as ICT presents it in the lesson: a projection based on the size of the marked high-to-low range. The transcript does not describe a conventional statistical calculation using a dataset, mean, and measured dispersion.
ICT OTE Liquidity Before Fibonacci Tools
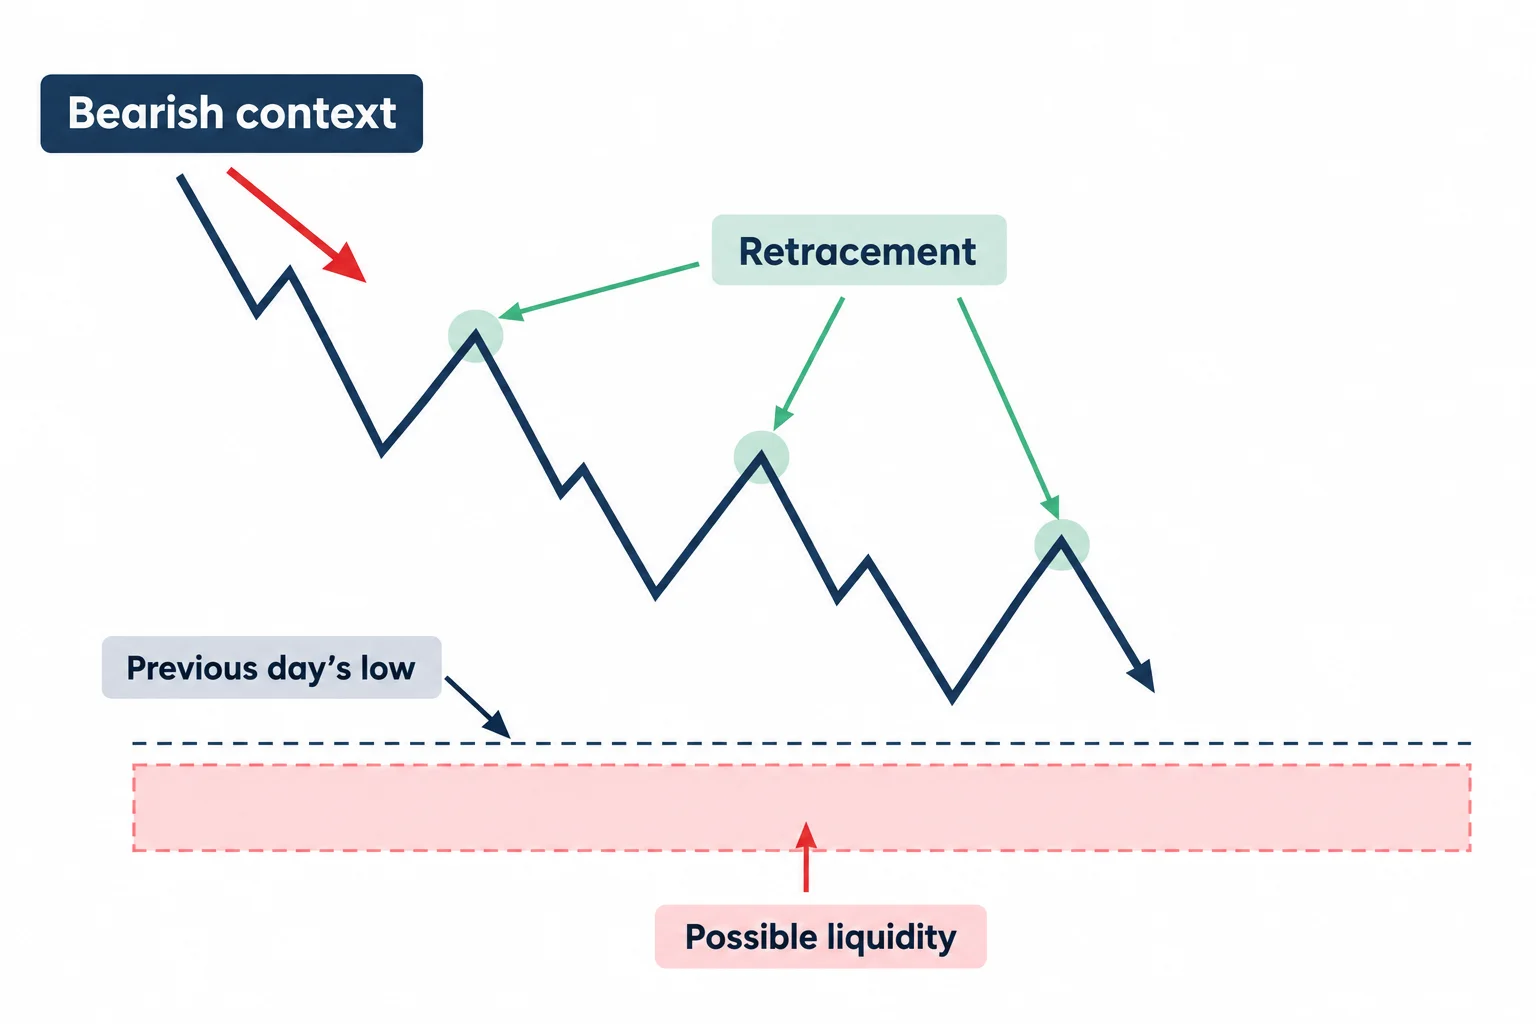
The main conceptual point appears at 2:47. ICT explicitly argues that the anticipated decline is not caused by a Fibonacci retracement. In his market interpretation, price is drawn toward liquidity below the previous day’s low, while the retracement framework helps define and measure the setup.
He also notes that movement toward a liquidity objective need not happen in one uninterrupted leg. Price can make several passes and retracements before reaching the referenced low. This distinction helps clarify the pattern-recognition exercise: the prior-day low supplies the directional objective, the bearish structure supplies context, and the lower-time-frame retracement supplies a possible execution model.
ICT OTE Pattern Recognition Takeaways
Viewed as a chart-reading lesson, Volume 5 demonstrates a structured workflow rather than a standalone signal. The sequence is higher-time-frame bias, a prior-day liquidity reference, session-specific lower-time-frame analysis, a retracement into a designated candle area, and range-based projections.
These concepts reflect ICT’s interpretation of market behavior and should not be treated as proof of a repeatable trading edge. The short transcript does not provide testing across multiple samples, complete risk assumptions, or evidence of profitability. Futures trading involves substantial risk, and the historical illustration is educational rather than investment advice.
Watch the Lesson
If the embed does not play, watch on YouTube.
Related Resources
- Primary Source: ICT OTE Pattern Recognition Series – Vol. 05 (YouTube)
- CME Group E-mini S&P 500 Futures Contract Specifications — for handle/tick value context.
- CME Institute: Introduction to Futures — educational reference on futures mechanics.




