
Key takeaways
ICT demonstrates a top-down OTE pattern-recognition exercise on USD/JPY, using a daily swing range and roughly 62% Fibonacci retracement to form a bullish thesis before moving to a five-minute setup targeting the prior day’s 106.657 high.
Read the full summary
ICT demonstrates a top-down OTE pattern-recognition exercise on USD/JPY, using a daily swing range and roughly 62% Fibonacci retracement to form a bullish thesis before moving to a five-minute setup targeting the prior day’s 106.657 high. Wednesday’s 106.629 high was exceeded by Thursday’s 106.657 high, suggesting possible upside expansion. During the eight thirty a.m. to eleven a.m. New York window, the hypothetical entry is approximately 106.315 with a 106.215 stop and ten pips of risk, followed by proposed scale-outs near an old high at 15 pips, a second area around 25 pips, and a Fibonacci-derived level above the prior-day high at roughly 40 pips. A second OTE swing forms around ten fifty five a.m., five minutes before the session cutoff. The lesson stresses that OTE is not a standalone Fibonacci signal and depends on higher-time-frame direction, liquidity objectives, session timing, dealing-range selection, swing anchors, and predefined risk, while the retrospective example provides no evidence of actual execution, fills, realized performance, or broad profitability.
How we researched this article
BestProps used document-based research from primary firm sources, checked September 25, 2026. The complete source list, scope, limitations, and commercial-state record appear near the end of this article.
In OTE Pattern Recognition Series – Vol. 02, ICT presents a pattern-recognition exercise using USD/JPY. The lesson moves from a daily-chart dealing range to a five-minute setup, with the prior day’s high serving as the stated objective. The emphasis is on recognizing a retracement within a broader directional idea rather than treating a Fibonacci level as a complete signal by itself.
ICT OTE Daily Range Setup
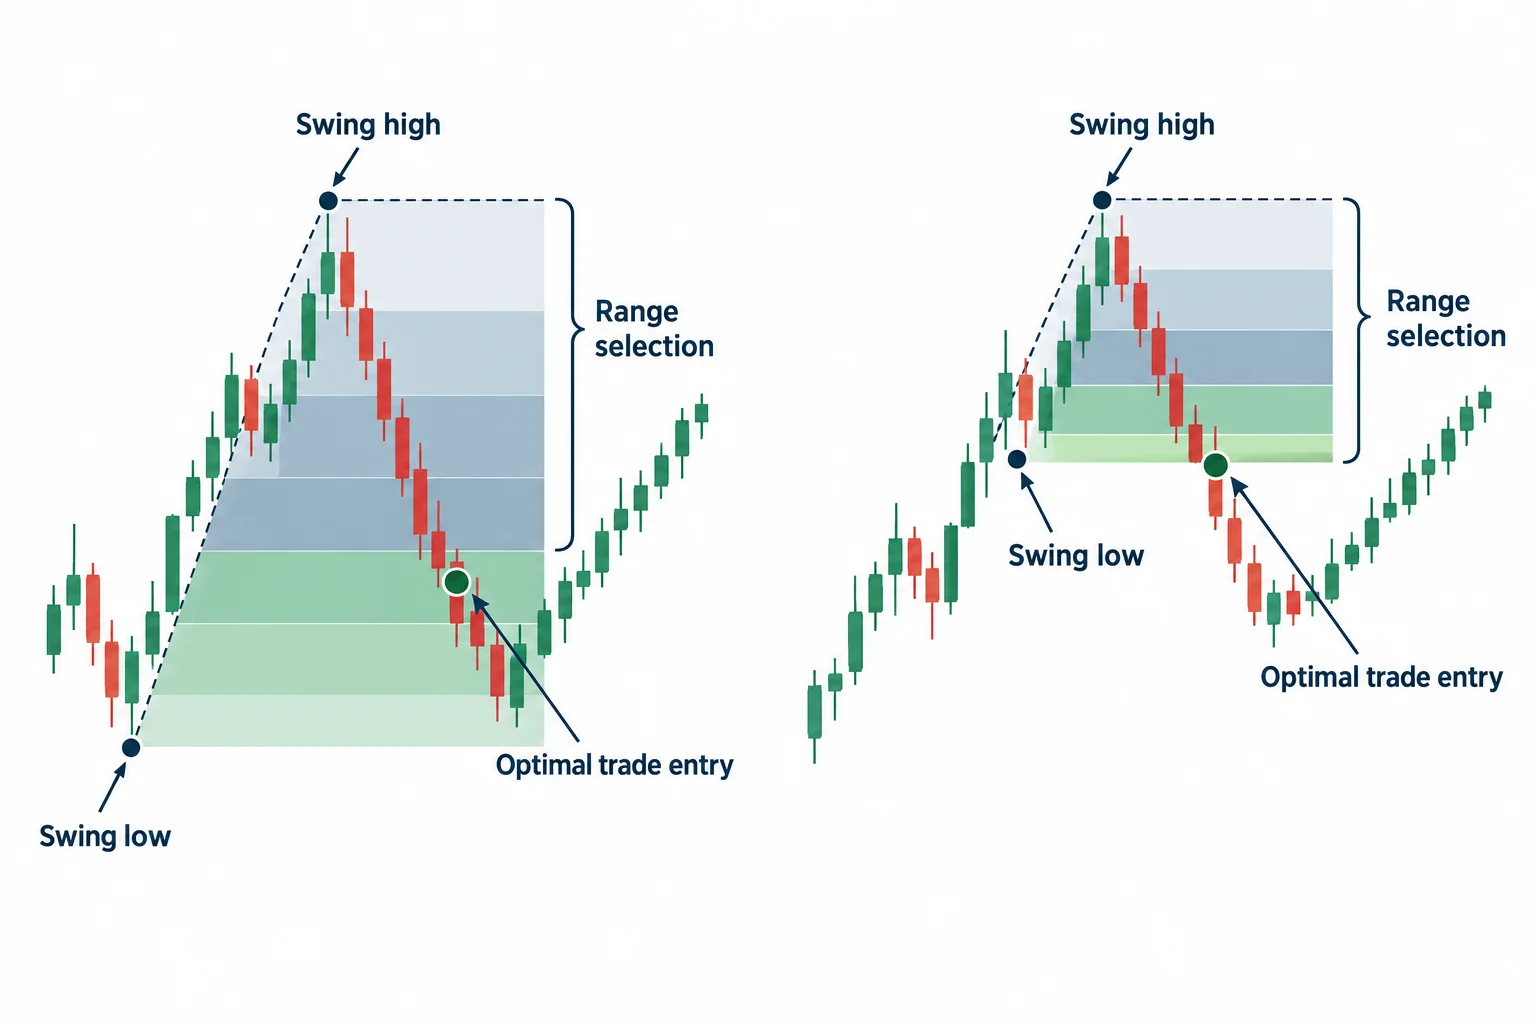
At 0:26, ICT asks viewers to inspect the daily chart and consider why a reaction might occur. He draws a Fibonacci range from a visible swing low to a swing high and extends its levels forward in time. In his terminology, price eventually trades into the daily-time-frame “optimal trade entry,” or OTE, area.
ICT explains that the selected range should reflect the price structure currently available. If price had moved below the cited swing low, he says a different low would have been needed for the measurement. This makes range selection an important part of his analysis: the retracement percentages depend on which swing anchors are chosen.
Beginning around 1:31, he notes that USD/JPY had entered or moved below what the captions render as the “62%” level. The generated transcript calls it a “Chasen” or “adjacent” level in several places, but the surrounding discussion strongly indicates that he is referring to a Fibonacci retracement level within the OTE framework.
ICT OTE Target at the Previous Day’s High
ICT then points to a shift in short-term behavior: Thursday’s trading moved above Wednesday’s high. The transcript gives Wednesday’s high as 106.629 and Thursday’s high as 106.657. He interprets that breach as evidence of willingness to trade beyond the prior daily range and therefore as a possible sign of upside expansion, not as certainty that price must continue higher.
At 2:28, the lesson drops to a five-minute USD/JPY chart. ICT briefly invites viewers to pause the recording and identify the pattern before hearing his explanation. This reflects the video’s practical purpose: it is framed as a recognition drill rather than a comprehensive strategy test.
USD/JPY Five-Minute ICT OTE Example
On the lower-time-frame chart, ICT marks the previous day’s range and says he is looking for a reason to be long, with the previous day’s high at 106.657 as the objective. He focuses on the New York-session window from 8:30 a.m. to 11:00 a.m. New York time, shown beginning near 3:31.
Price then retraces into the level that he identifies as approximately 106.314, rounded to 106.315. ICT presents that as the hypothetical entry and places the example stop at 106.215, describing the distance as ten pips. He subsequently outlines several potential scaling points:
- An old high approximately 15 pips from the stated entry, which he says meets his minimum criterion for a first scale-out.
- A second area at roughly 25 pips, still below the prior day’s high.
- A further Fibonacci-derived level above the previous day’s high, described as offering approximately 40 pips.
These levels are explained at 3:58–4:50. They are ICT’s retrospective chart annotations and proposed management framework. The transcript alone does not establish actual order execution, fills, slippage, or realized results.
Second ICT OTE Pattern Near the Session Cutoff
Near 4:52, ICT identifies another swing that he counts as “one, two, three, four” and calls another OTE. He notes that its low formed around 10:55 a.m., five minutes before the end of his stated 8:30–11:00 New York trading window. He leaves this second example for viewers to examine independently and briefly notes a run above an earlier high.
ICT OTE Pattern Recognition Lessons
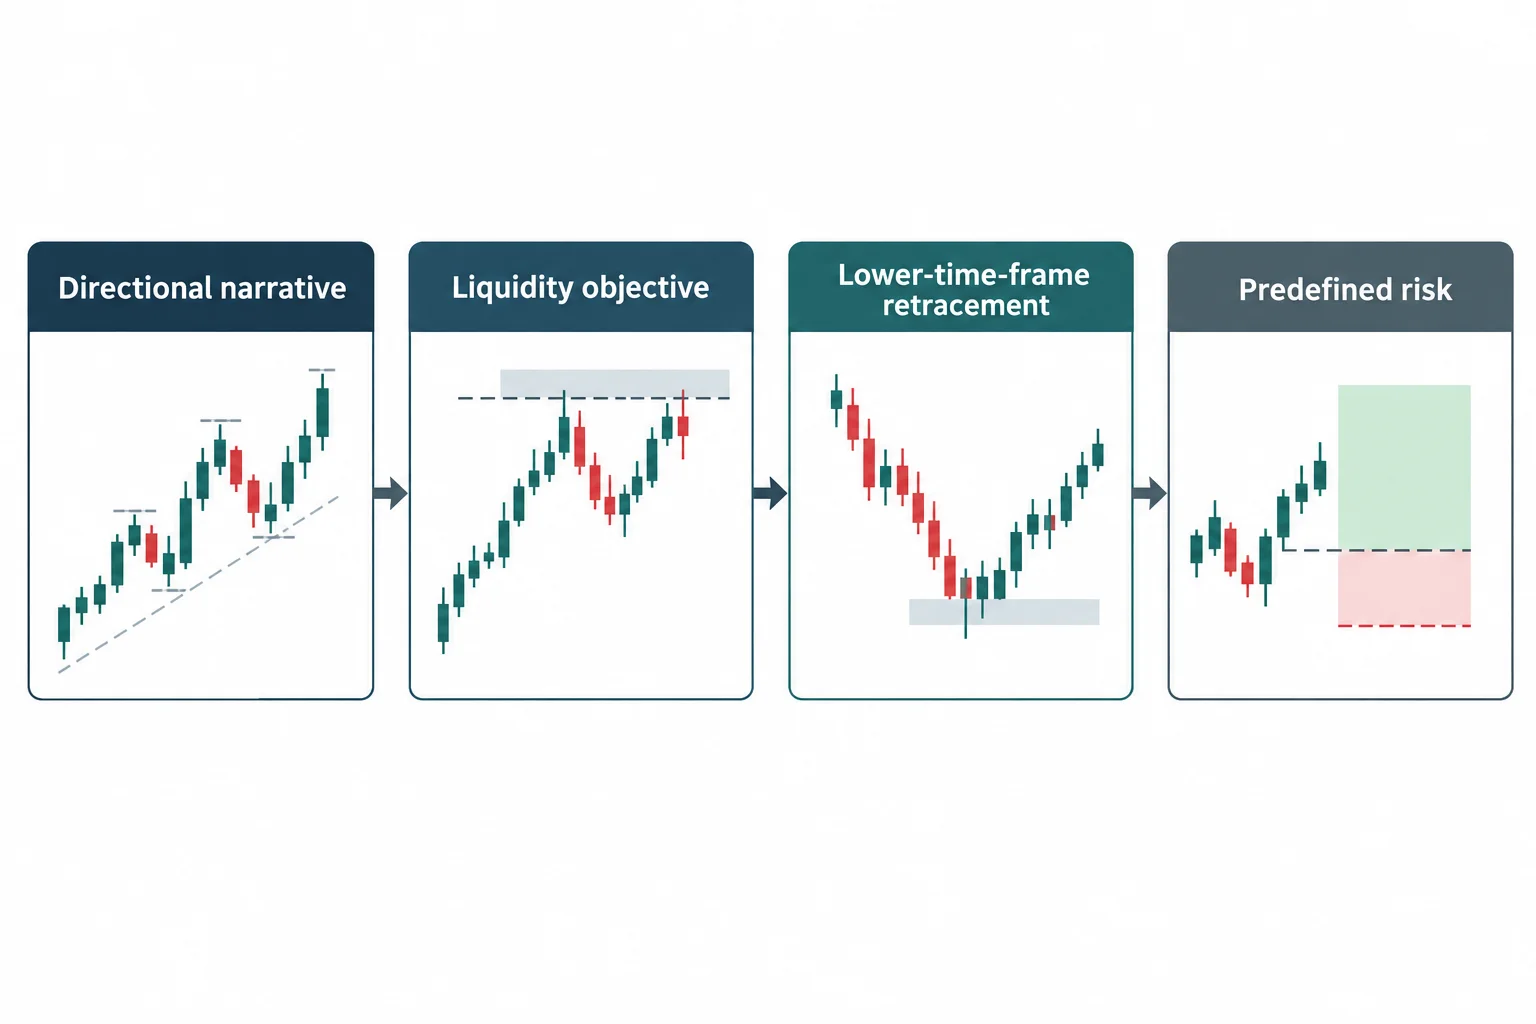
The lesson illustrates a top-down process: establish a directional narrative from a daily swing, identify a nearby liquidity objective such as a prior daily high, and then look for a lower-time-frame retracement during a defined session. Within ICT’s interpretation, the OTE measurement helps organize a possible entry, while old highs and Fibonacci-derived extensions provide possible scale-out references.
The most important analytical distinction is that the retracement level is not presented in isolation. The example combines higher-time-frame context, a prior high, intraday timing, a selected dealing range, and predefined risk. Those choices are partly discretionary, especially the selection of swing anchors. This video demonstrates ICT’s reading of one historical chart; it does not by itself test whether the pattern is reliable or profitable across markets and periods.
This summary is for education only and is not investment advice or a performance claim.





