
Key takeaways
ICT’s OTE Pattern Recognition Series Volume 13, uploaded May 27, 2020, examines a bearish USD/CAD Optimal Trade Entry by pairing daily bearish context with a five-minute New York-session retracement.
Read the full summary
ICT’s OTE Pattern Recognition Series Volume 13, uploaded May 27, 2020, examines a bearish USD/CAD Optimal Trade Entry by pairing daily bearish context with a five-minute New York-session retracement. ICT argues that a large prior decline does not invalidate continuation when equal daily lows remain potential sell-side liquidity, then identifies a retracement into the OTE area between eight thirty a.m. and eleven a.m. New York time. For the dealing range, he favors the earlier swing high that directly preceded bearish displacement and contained concentrated candle bodies rather than automatically using a marginally higher wick. A slight move beyond the OTE zone is not treated as decisive invalidation, while a hypothetical protective stop belongs above the relevant short-term high according to individual risk tolerance. The old low and standard-deviation projections provide possible objectives, with the session low described as aligning with a projected level and demonstrating symmetry. The exact retracement percentage and projection values should be checked on the video chart because the automated transcript is ambiguous, not exact. The lesson presents retrospective educational analysis, not evidence of live fills, transaction costs, repeatable profitability, investment advice, or a performance promise.
How we researched this article
BestProps used document-based research from primary firm sources, checked September 25, 2026. The complete source list, scope, limitations, and commercial-state record appear near the end of this article.
In OTE Pattern Recognition Series – Vol. 13, uploaded May 27, 2020, ICT examines a bearish Optimal Trade Entry example in USD/CAD. The lesson connects a daily-chart bearish context with a five-minute retracement during the New York session. Its central point is that a large prior decline does not, by itself, invalidate another bearish setup.
Daily ICT OTE Pattern Context
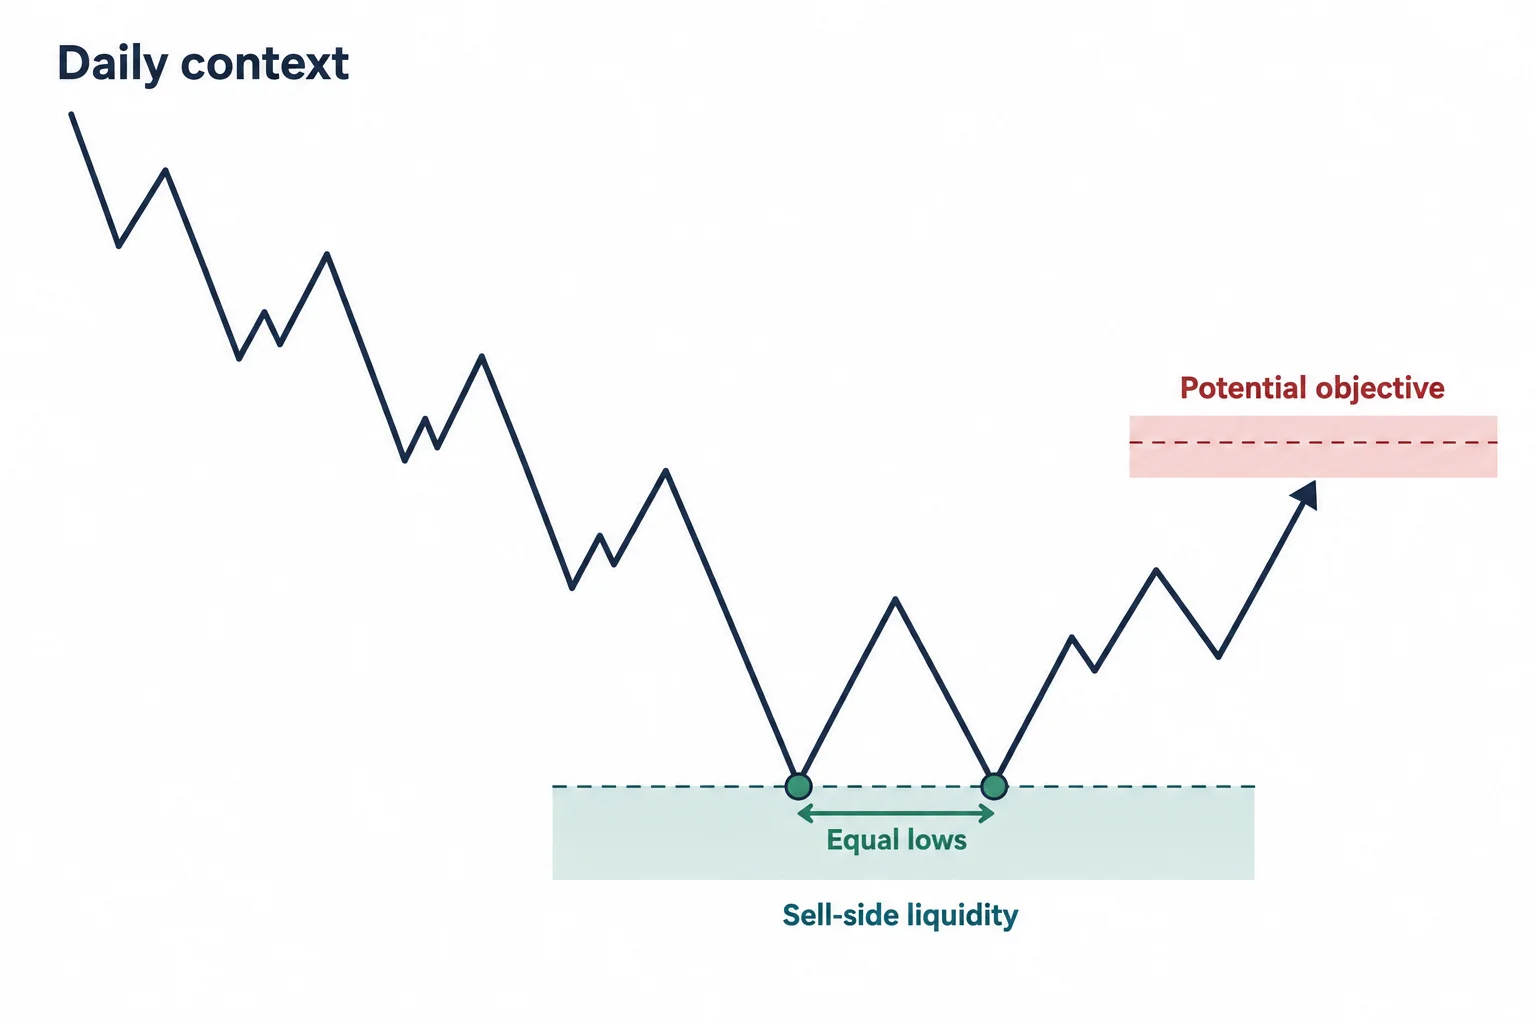
ICT introduces the example as part of his continuing OTE pattern-recognition series and asks viewers to begin with the daily chart, even though the immediate example uses a five-minute chart. At 0:19, he says the daily chart had formed an Optimal Trade Entry before a strong move lower.
He then addresses a common reaction to an extended decline: assuming that price has already fallen too far and therefore must reverse. ICT argues that this assumption can undermine a trader’s willingness to recognize a continuation pattern. In his interpretation, the relevant question is not whether the market looks conventionally “oversold,” but where liquidity may remain available.
At 0:54, ICT says the same bearish logic remains in force despite the preceding decline. He identifies equal lows on the daily chart as potential sell-side liquidity and combines that observation with the daily OTE framework. “Liquidity” here is terminology from ICT’s methodology; the video presents his market interpretation rather than an independently established trading edge.
ICT OTE New York Retracement Pattern
After adding annotations, ICT marks the New York-session window as 8:30 a.m. to 11:00 a.m. New York time. The five-minute chart shows a retracement during that window into what he labels an Optimal Trade Entry area. This portion begins around 1:42.
ICT notes that price moved slightly beyond the marked area. He does not treat that small extension as automatically invalidating the idea. Instead, he emphasizes placing the retracement within the larger bearish structure and selecting the swing used to define the range consistently.
How ICT Selects the OTE Reference Swing
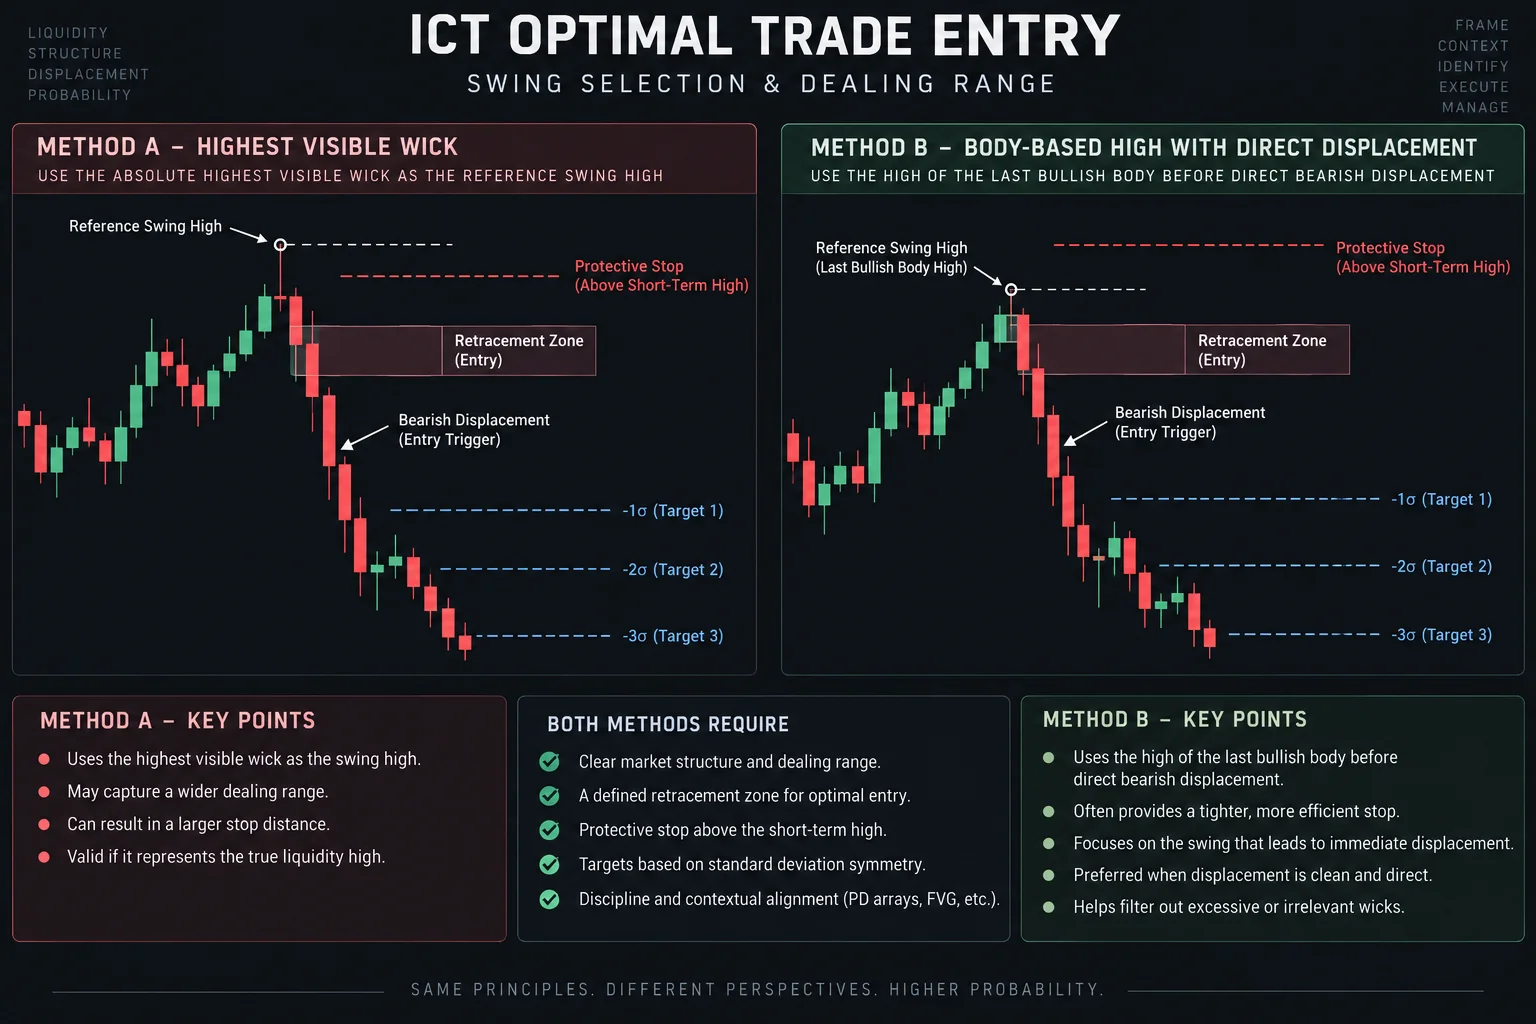
At 2:13, ICT compares two possible swing highs. Although one point is marginally higher, he prefers an earlier high because it directly precedes the displacement lower. He also contrasts the concentration of candle bodies around that point with the wick at the alternative high.
This illustrates an important feature of the lesson: swing selection is not presented as merely choosing the chart’s highest visible wick. ICT instead considers where the decisive move began and how candle bodies were distributed. Because the transcript cannot show the chart, viewers should consult the linked video before attempting to reconstruct the exact anchors.
ICT OTE Risk Placement and Price Targets
ICT next applies a retracement level used in his OTE model, although the automatically recognized wording at 2:53 is unclear. The captions appear to contain a recognition error, so the precise percentage should be checked against the chart rather than inferred from the transcript alone.
For a hypothetical bearish setup, he says a protective stop would need to sit above a relevant short-term high, with the final distance determined by the trader’s risk tolerance. This is a description of the lesson, not a recommendation to use any particular stop size or percentage.
From approximately 3:13, ICT discusses the old low and several standard-deviation projections. He states that the session low aligned with one of those projected levels and describes the result as an example of symmetry. Several numbers in this section are compressed or ambiguous in the automated transcript, and the unseen chart is necessary to verify their exact values.
Key ICT OTE Pattern Lessons
- Use higher-timeframe context: ICT begins with the daily bearish structure before examining a five-minute entry pattern.
- Do not rely on “too far” reasoning alone: In ICT’s framework, a substantial decline does not necessarily remove the possibility of continuation.
- Identify the proposed liquidity objective: Equal lows are interpreted by ICT as a possible draw on price.
- Define the dealing range deliberately: He favors the swing associated with direct bearish displacement rather than automatically selecting the highest wick.
- Allow for imperfect contact with a zone: A slight move beyond the marked OTE area is not treated as decisive in isolation.
- Separate entry logic from risk control: The pattern does not determine an appropriate position size or acceptable loss for every trader.
How to Interpret the ICT OTE Pattern
More broadly, this lesson can be read as an exercise in top-down chart analysis: form a directional thesis on a higher timeframe, identify a lower-timeframe retracement, define invalidation, and map possible objectives before judging the example. That workflow is a general educational interpretation of the presentation, not proof that the specific pattern predicts future price movement.
The transcript records ICT’s retrospective explanation, but it does not establish live execution, fills, slippage, transaction costs, or repeatable profitability. The chart itself is also essential because the spoken commentary refers repeatedly to visual annotations. Viewers can review ICT’s closing summary at 3:53. This material is educational and is not investment advice or a performance promise.




