
How we researched this article
BestProps used document-based research from primary firm sources, checked September 25, 2026. The complete source list, scope, limitations, and commercial-state record appear near the end of this article.
In this lesson we explore how ICT interprets the E-mini S&P (ES) futures contract, focusing on the contrast between the morning trend (9:30 AM – 11:00 AM EST) and the afternoon trend (1:00 PM – 4:00 PM EST). We examine how a bearish macro environment creates specific entry signals on lower-timeframe charts, and how to identify optimal trade entries using price-action frameworks. Watch the full lesson on YouTube.

Macro Context: Bearish Day & Up-Close Candles
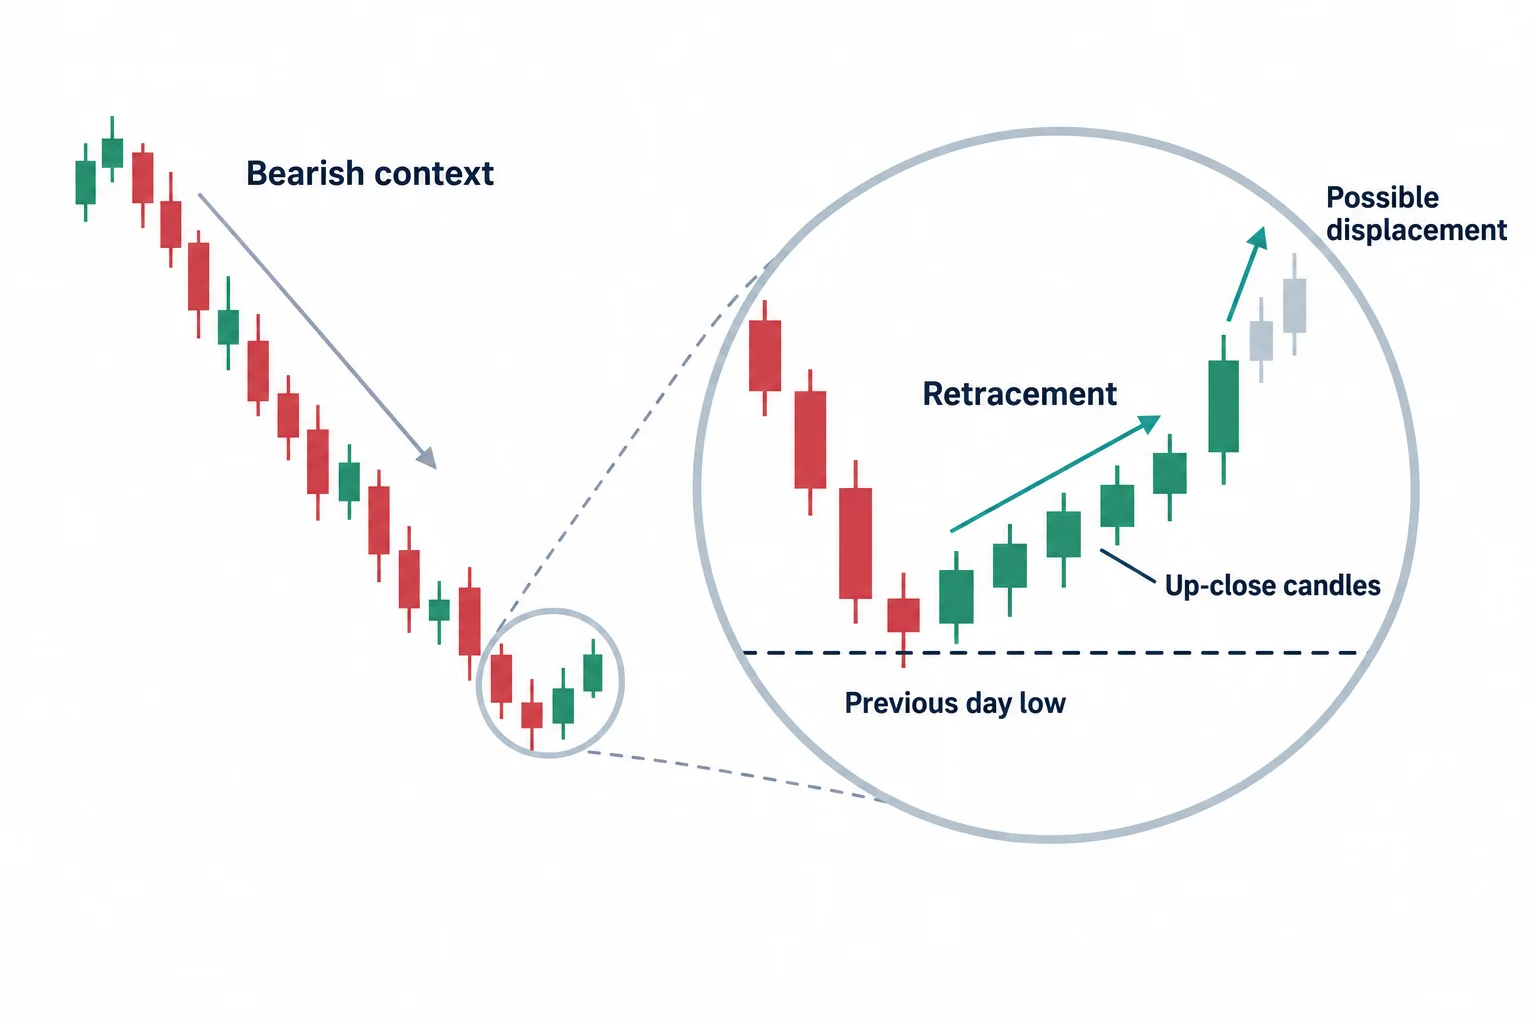
Prior to today’s trading session the market experienced a significant down-day. When the broader market is bearish, the key tactical cue is to watch for up-close candles – price that retraces toward the previous day’s low while the macro sentiment remains negative. These candles indicate heightened sensitivity and potential displacement on shorter timeframes.
Afternoon Trend (1:00 PM – 4:00 PM EST)
The afternoon session represents a distinct trend window for equities and their index futures (NQ, ES, YM). Traders seeking intraday alpha should focus on this period, as it offers clearer price-action patterns compared to the slower-moving morning window.
Micro-Market Structure on 1-Minute Charts
- Imbalance: When price moves below the level added relative to the preceding up-close candle, the market signals an imbalance that often precedes a reversal.
- Optimal Entry: The ideal trade entry occurs when price trades up into the identified level, providing a tight risk-to-reward setup.
- Fib Projection: Using the parent price swing, a Fibonacci extension targets approximately $32.1875 as the next logical resistance level.
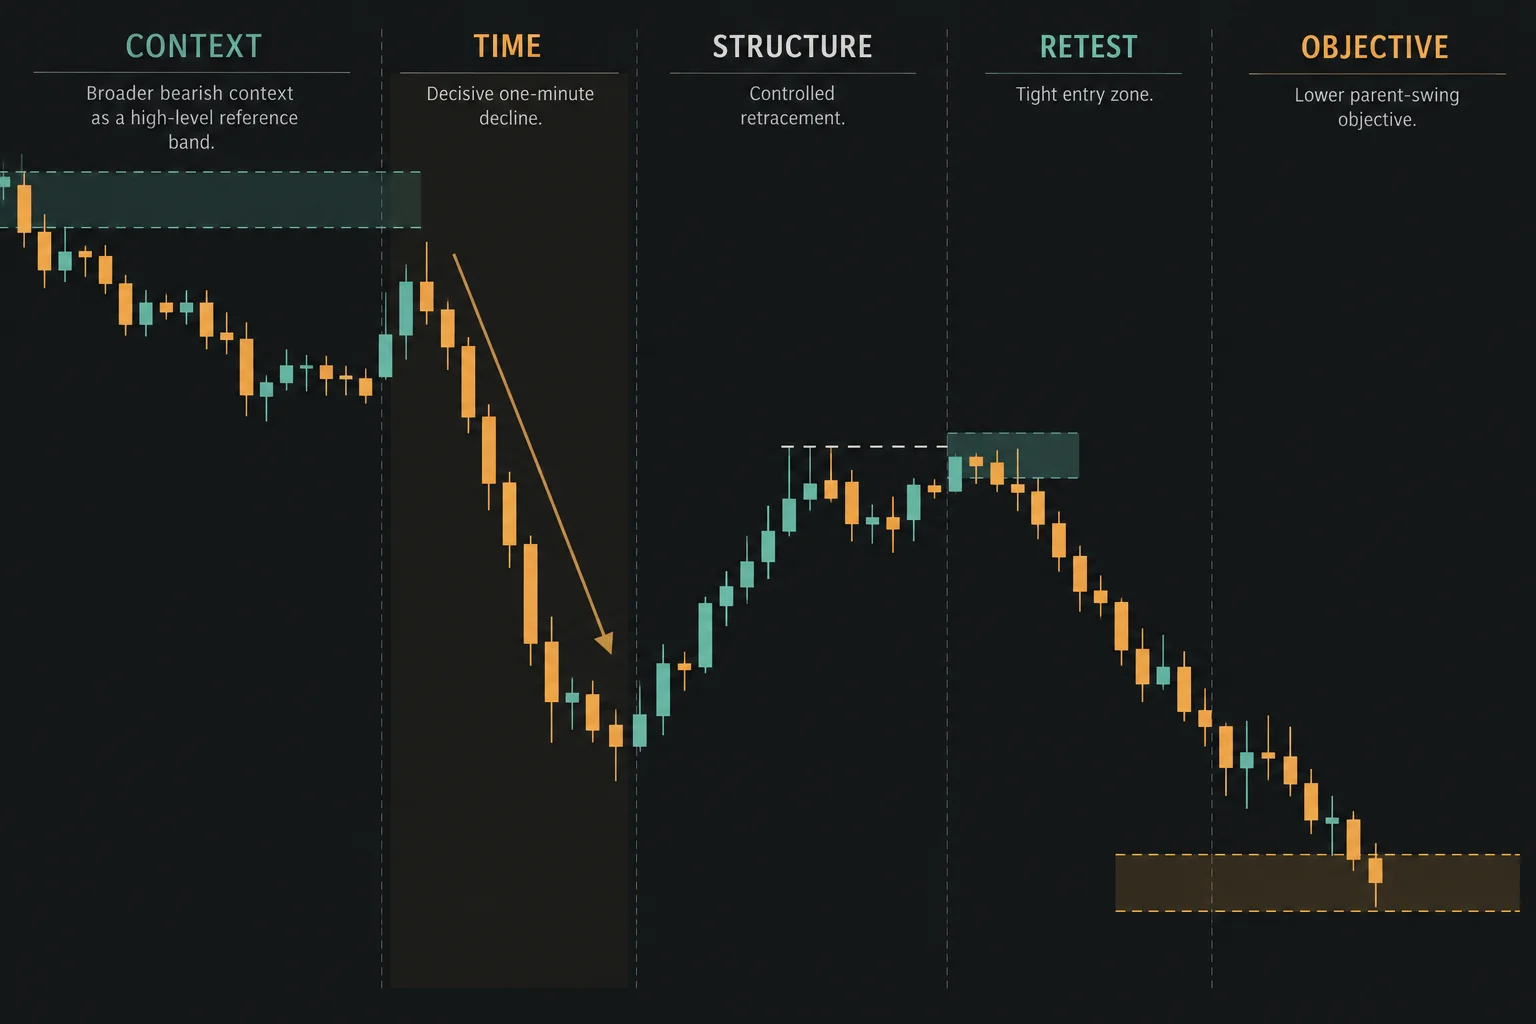
Target Levels & Execution
Based on the Fibonacci projection and the observed price action, the target zone is $32.1875 (the projected low derived from the parent swing). The candle that opened at $32.56 and closed near $32.56 provides a tight range-bound entry zone. When price breaches $32.1875, it confirms the optimal trade entry and positions the trade for a strong move toward the next leg of the swing.
Key Takeaways
- Identify the morning vs. afternoon trend to allocate time-based focus.
- Look for up-close candles in a bearish macro environment as a signal for lower-timeframe entry.
- Use micro-market-structure analysis on 1-minute charts to pinpoint optimal trade entries.
- Apply Fibonacci extensions from the parent swing to define target levels (e.g., $32.1875).
- Confirm entry by watching price trade up into the level, then scale into the trade.
All observations are based on the E-mini S&P (ES) futures contract (December delivery) and the specific 1-minute chart discussed in the lesson.





