
Key takeaways
ICT W.E.N.T.
Read the full summary
ICT W.E.N.T. Series 4 of 5, uploaded October 24, 2017, presents a trading framework that starts with macro direction, maps horizontal support and resistance, waits for price to reach predetermined areas, and then requires rejection, displacement, a failed retest or a market-structure shift before considering entries. Natural levels include 12-month, quarterly, monthly, weekly and daily highs and lows, session extremes and intraday swings, while implied levels include Fibonacci retracements, extensions and pivot points. For GBP/USD, ICT highlights prices ending in 00, 20, 50 and 80 as institutional reference levels. From 51 minutes 15 seconds, COT analysis compares small speculators, large speculators and commercials, focusing on commercial net positioning, the zero line and fresh 12-month or four-year extremes as macro warnings rather than immediate signals. Daily 18-period and 40-period exponential moving averages are assessed by separation or stacking rather than crossover alone. The weekly-range model proposes that bearish weekly highs or bullish weekly lows often form during Tuesday or Wednesday London sessions, though the article says its probabilities are unsupported. SMT divergence compares correlated markets for disagreement at corresponding highs or lows and serves only as a market-selection tool, with higher-time-frame levels, structural confirmation and a separate entry pattern still required. The article stresses that institutional explanations, profitability claims and recurring timing patterns are ICT interpretations that require independent testing.
How we researched this article
BestProps used document-based research from primary firm sources, checked September 25, 2026. The complete source list, scope, limitations, and commercial-state record appear near the end of this article.
ICT Series 4 Support Resistance and Swing Overview
In ICT W.E.N.T. Series – 4 of 5, uploaded on October 24, 2017, ICT presents an extended lesson connecting horizontal support and resistance with Commitment of Traders (COT) analysis, market structure, institutional price levels and swing-trade planning. The central theme is that tools and patterns should be interpreted within a predetermined price and directional framework rather than used as isolated signals.
The presentation contains strong claims about institutional behavior and ICT’s own trading experience. Those claims represent ICT’s interpretation of markets; the transcript does not independently establish their accuracy or profitability. The lesson is best approached as a framework to study and test, not as evidence of a proven trading edge.
ICT Support and Resistance Foundations
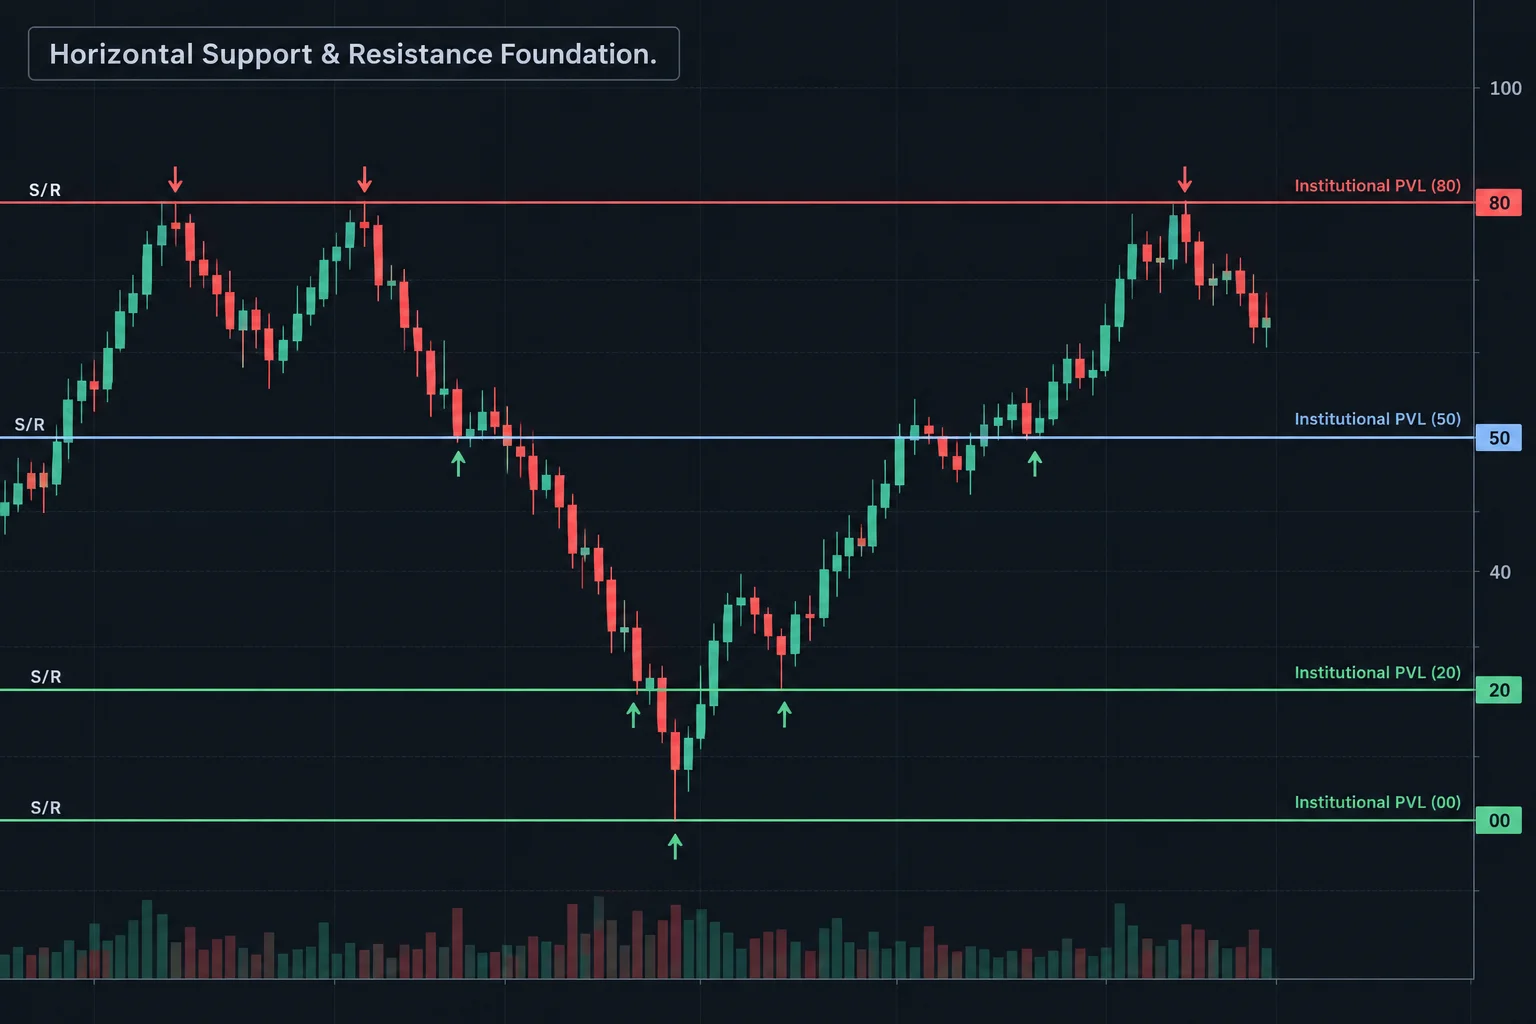
ICT begins by arguing that support and resistance remain essential even for experienced or indicator-based traders. At 2:48, he states his preference for horizontal levels over diagonal trend lines. His reasoning is that horizontal prices provide fixed reference points at which traders can observe whether buying or selling pressure appears to change.
The practical distinction is between reacting to a move after it begins and preparing for price to reach a known area. Around 8:15, ICT describes marking a level in advance and deciding what evidence would matter when price arrives. He later says that a pattern should be sought at a predetermined level, rather than finding a pattern first and then searching for a nearby justification.
His proposed confirmation sequence at resistance includes a pause or rejection, a decisive move away and, in some cases, a failed return to the level. The bullish version reverses that logic. Importantly, ICT also acknowledges that support and resistance are not guaranteed turning points and that price may trade through a level before reacting.
Natural and Implied Support Levels
At 25:41, ICT divides support and resistance into two broad categories:
- Natural levels: 12-month, quarterly, monthly, weekly and daily highs and lows; session extremes; and intraday swing points.
- Implied levels: calculated references such as Fibonacci retracements or extensions and pivot points.
He gives particular attention to previous monthly and weekly extremes, while intraday traders are encouraged to monitor the prior Asian, London and New York session highs and lows. His session references generally use New York local time, as clarified near 38:07.
ICT also introduces what he calls institutional price levels at 41:12. For the quoted GBP/USD convention, these are prices ending in 00, 20, 50 and 80. He treats them as psychologically and institutionally relevant reference points. The transcript does not provide independent order-book evidence for the institutional explanation, so this should be understood as ICT’s model rather than a verified fact.
ICT COT Analysis as a Macro Filter
The lesson changes focus at 51:15, where ICT introduces COT analysis. He describes three groups: small speculators, large speculators and commercial participants. His analysis concentrates on the relationship between large speculators, whom he characterizes as trend followers, and commercials, whom he treats as hedgers with closer exposure to underlying supply-and-demand conditions.
ICT’s main COT study is the commercial net position relative to its own history. He highlights fresh 12-month and four-year extremes as possible warnings that a long-term trend may be approaching a transition. However, he repeatedly cautions that an extreme is not an immediate entry signal. Commercial positioning can remain extreme for months, so he calls for confirmation through support or resistance, price rejection and a market-structure shift.
The zero line and net-position concept are explained near 1:04:51. Above zero represents a net-long commercial position; below zero represents net short. ICT then proposes following the broader trend of commercial positioning rather than treating every weekly change as equally meaningful.
Swing Structure and Moving Averages
Once a possible macro turn is identified, ICT looks for resistance to break and become support in a bullish case, with the reverse applying in a bearish case. At 1:17:48, he adds 18-period and 40-period exponential moving averages on a daily chart. He is less interested in the crossover itself than in the averages separating or “stacking,” which he interprets as evidence of momentum.
This creates a layered process: COT positioning supplies a macro premise, higher-time-frame levels identify decision areas, market structure provides confirmation, and lower-time-frame retracements are then studied for entries. ICT emphasizes that this approach will miss moves and that traders do not need to participate in every fluctuation.
ICT Swing Analysis With Weekly Ranges and SMT Divergence
At 2:02:11, ICT discusses a weekly-range model. In his framework, a bearish week often forms its high around Tuesday’s or Wednesday’s London session, while a bullish week may form its low in the same general window. The numerical probabilities he mentions are unsupported by testing in the transcript and should not be treated as established statistics.
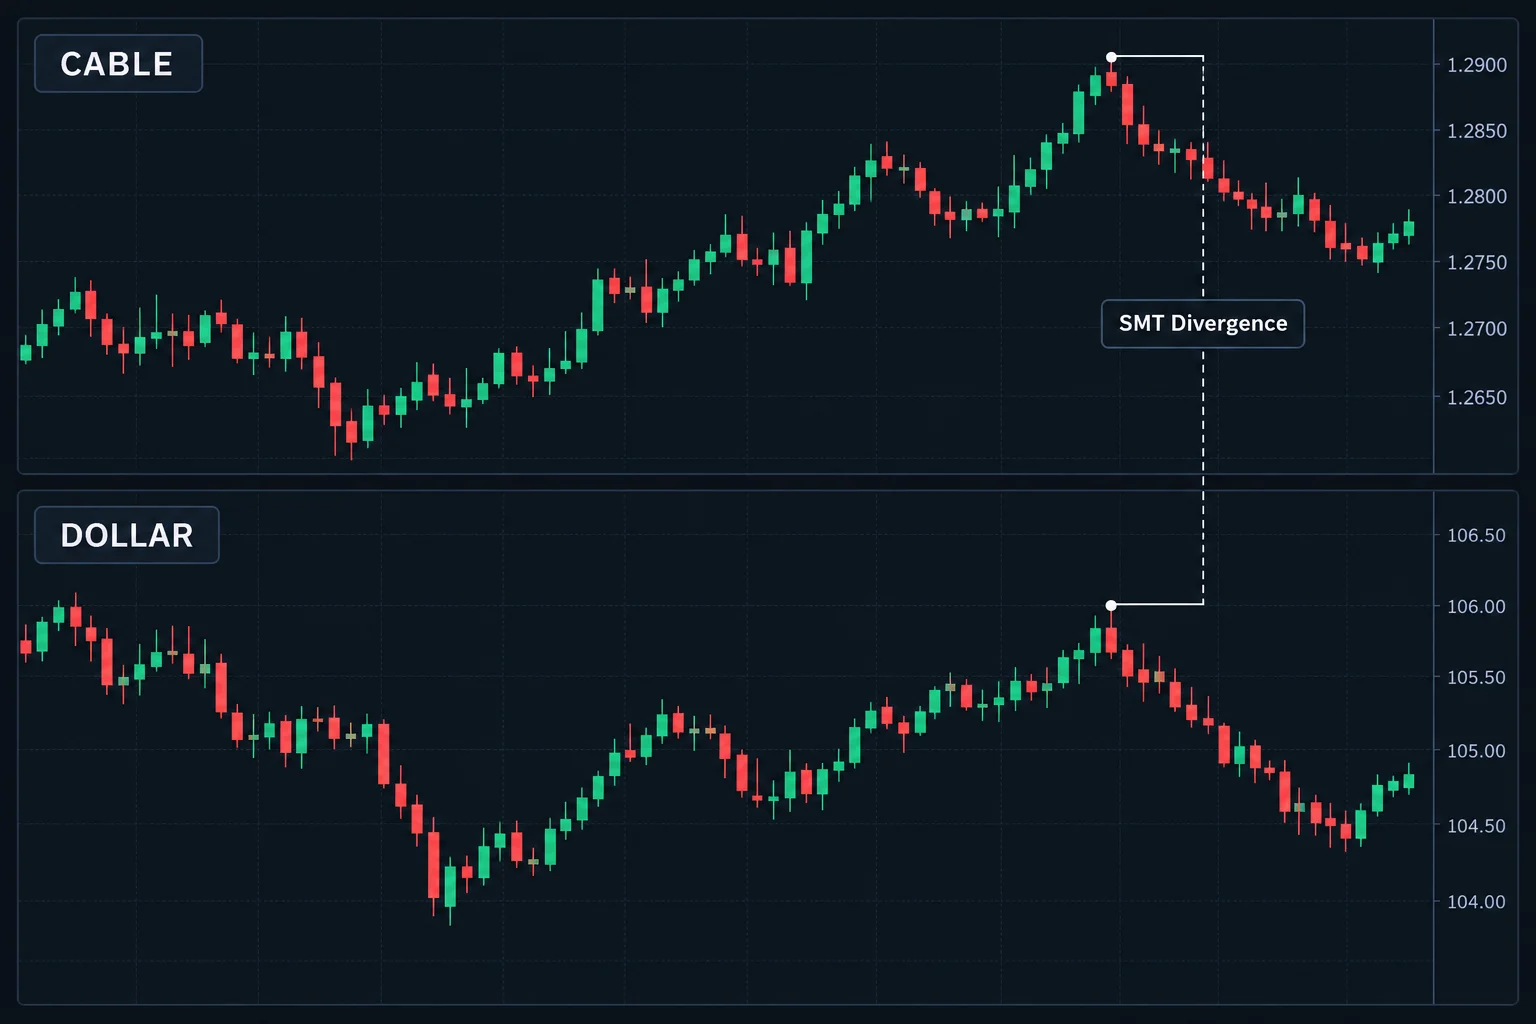
The final major topic begins near 2:16:14: SMT divergence, short for ICT’s “smart money tool.” It compares correlated markets and looks for disagreement at corresponding highs or lows. ICT traces the general idea to Dow Theory: correlated instruments are expected to confirm one another, while a failure to confirm may indicate relative accumulation or distribution.
ICT explicitly describes SMT divergence as a selection tool rather than a timing signal. His intended workflow is to use the divergence to identify a market worth studying, then require higher-time-frame support or resistance, a structural shift and a separate entry pattern.
ICT Support and Resistance Lessons
The most transferable idea is not any single level or indicator. It is the hierarchy ICT applies: begin with macro context, map horizontal reference points, wait for price to reach them, and only then evaluate confirmation. For educational review, each component can be documented separately and tested without assuming that claims about institutions, win rates or recurring timing patterns are correct. Historical chart examples are useful for illustrating the vocabulary, but they do not by themselves establish what could have been known or executed in real time.
Watch the original lesson on YouTube
The video cannot be played inside another website: when its embedded player was opened on 22 September 2026 it returned a YouTube “Video player configuration error” (Error 153), the player-level sign that the author restricted off-site playback. That is why a watch link is used instead of a reserved or blank embed; the recording itself is available directly on YouTube.
ICT Series Sources and Further Reading
- The original Inner Circle Trader lesson: use the timestamp links in this article to compare the explanation with its source.
- CFTC Commitment of Traders reports: the source of the positioning data ICT references.
- 17 CFR 4.41: disclosures concerning hypothetical performance: a regulatory reference, not a statement that a particular recording or this article meets every legal requirement.
This is independent educational commentary. It is not official ICT material, a tested trading system, or a claim that the reported results can be reproduced.





