
How we researched this article
BestProps used document-based research from primary firm sources, checked September 25, 2026. The complete source list, scope, limitations, and commercial-state record appear near the end of this article.
ICT Trading Plan Development 4 is a chart-organization lesson in which ICT assigns technical-analysis tools, reference levels, and session-specific references to charts ranging from the monthly timeframe down to five minutes. He then demonstrates saving the five-minute arrangement as an MT4 template so the same layout can be applied across currency pairs.
This article summarizes the framework presented in the primary video. The institutional explanations, probability claims, and ICT-specific terminology are ICT’s interpretations, not independently established findings or guarantees.
What the lesson covers
At 2:19, ICT outlines the agenda: define tools, assign them to particular timeframes, and demonstrate how MT4 templates can make that arrangement reusable. The proposed workflow moves from large to small timeframes — support and resistance identified on a higher timeframe are carried down to lower charts, and each lower chart contributes more detailed levels without discarding the broader context.
Assigning tools to each timeframe
Monthly timeframe
Beginning at 2:44, ICT assigns the monthly chart to the broadest market view. His checklist includes major support and resistance, significant swing highs and lows, Fibonacci retracements or extensions, classic price patterns, long-term direction, and one momentum indicator (stochastic, RSI, or MACD — presented as a choice, not a mandatory combination). He suggests consulting this chart periodically rather than treating it as an everyday execution chart. In ICT’s interpretation, monthly movement may have greater duration than intraday movement, so the monthly chart helps form the initial directional premise.
Weekly timeframe
At 5:13, the weekly chart inherits monthly levels and adds weekly market structure, swing points, and Fibonacci measurements. ICT also places Commitment of Traders (COT) analysis on this timeframe, using weekly positioning to interpret what he calls the commercial-trader trend. That interpretation should be understood as ICT’s analytical view, not a conclusion established by the transcript. He again allows a choice of momentum indicator and advises monitoring longer-term sentiment.
Daily timeframe
The daily-chart section starts at 8:20. Monthly and weekly levels remain visible, while the daily chart adds intermediate support and resistance, clearer swing structure, Fibonacci confluence, and total open interest for the related futures contract. ICT describes rising or falling open interest in terms of commercial short positioning; this is his stated interpretation in the lesson, and the captions do not provide data, methodology, or an empirical test supporting it. He also mentions momentum divergence and correlation concepts, including SMT terminology, but does not fully define those ideas here.
Four-hour timeframe
At 11:18, ICT describes the four-hour chart as useful across position, short-term, and day-trading perspectives. It carries down higher-timeframe levels and adds the previous month’s range, monthly pivot points, market structure, price patterns, and one momentum indicator. He specifically assigns monthly pivots to the four-hour chart and introduces his “Monthly Trinity,” based on the prior month’s range and associated matrix levels, but notes that its full explanation belongs to separate material. A practical simplification from this section is his instruction to select one preferred momentum tool rather than crowding the chart with many similar indicators.
One-hour timeframe
The one-hour framework begins at 15:34. Here ICT switches from monthly to weekly references: the previous week’s range, his “Weekly Trinity,” and weekly pivots. The chart is also used for short-term support and resistance, hourly market structure, swing-based Fibonacci levels, price patterns, and momentum.
The pivot hierarchy is therefore straightforward:
- Four-hour chart: monthly pivots.
- One-hour chart: weekly pivots.
- Fifteen- and five-minute charts: daily pivots.
This hierarchy is stated in the transcript; the captioned discussion does not establish that any pivot convention is superior.
Fifteen-minute timeframe
At 18:13, ICT adds the previous three days’ highs and lows to the 15-minute chart. The purpose is to view shorter-term swing or “fractal” formations while remaining aligned with the higher-timeframe premise. Other assigned references include daily pivots, the Asian range from 00:00 to 05:00 GMT, Fibonacci levels, price patterns, and ICT’s SMT or intermarket comparisons. He discusses toggling between GMT-based and New York-midnight pivot calculations while looking for overlapping levels. The transcript does not establish that either convention is superior.
Five-minute timeframe
ICT calls the five-minute chart the smallest timeframe he uses in this framework at 23:37. It retains daily pivots, the Asian range, recent daily highs and lows, and Fibonacci measurements. It also adds time-of-day “kill zones” and a five-day average daily range for intraday reference. Terms such as “kill zone” and “Judas swing” are ICT-specific labels in this lesson; they are mentioned but not fully taught here, so they should not be treated as self-explanatory trading rules.
Save the plan as an MT4 template
The final segment moves from planning to platform setup. Starting at 25:48, ICT demonstrates a five-minute MT4 chart with candlesticks, the Asian range (00:00–05:00 GMT), daily pivots, and average daily range. He then saves that arrangement as a template.
At 28:44, he opens another currency chart and loads the saved template instead of rebuilding the layout. The operational takeaway is useful regardless of the analytical concepts chosen: create a consistent template for each timeframe so charts can be reproduced quickly and reviewed under the same visual rules.
Takeaways
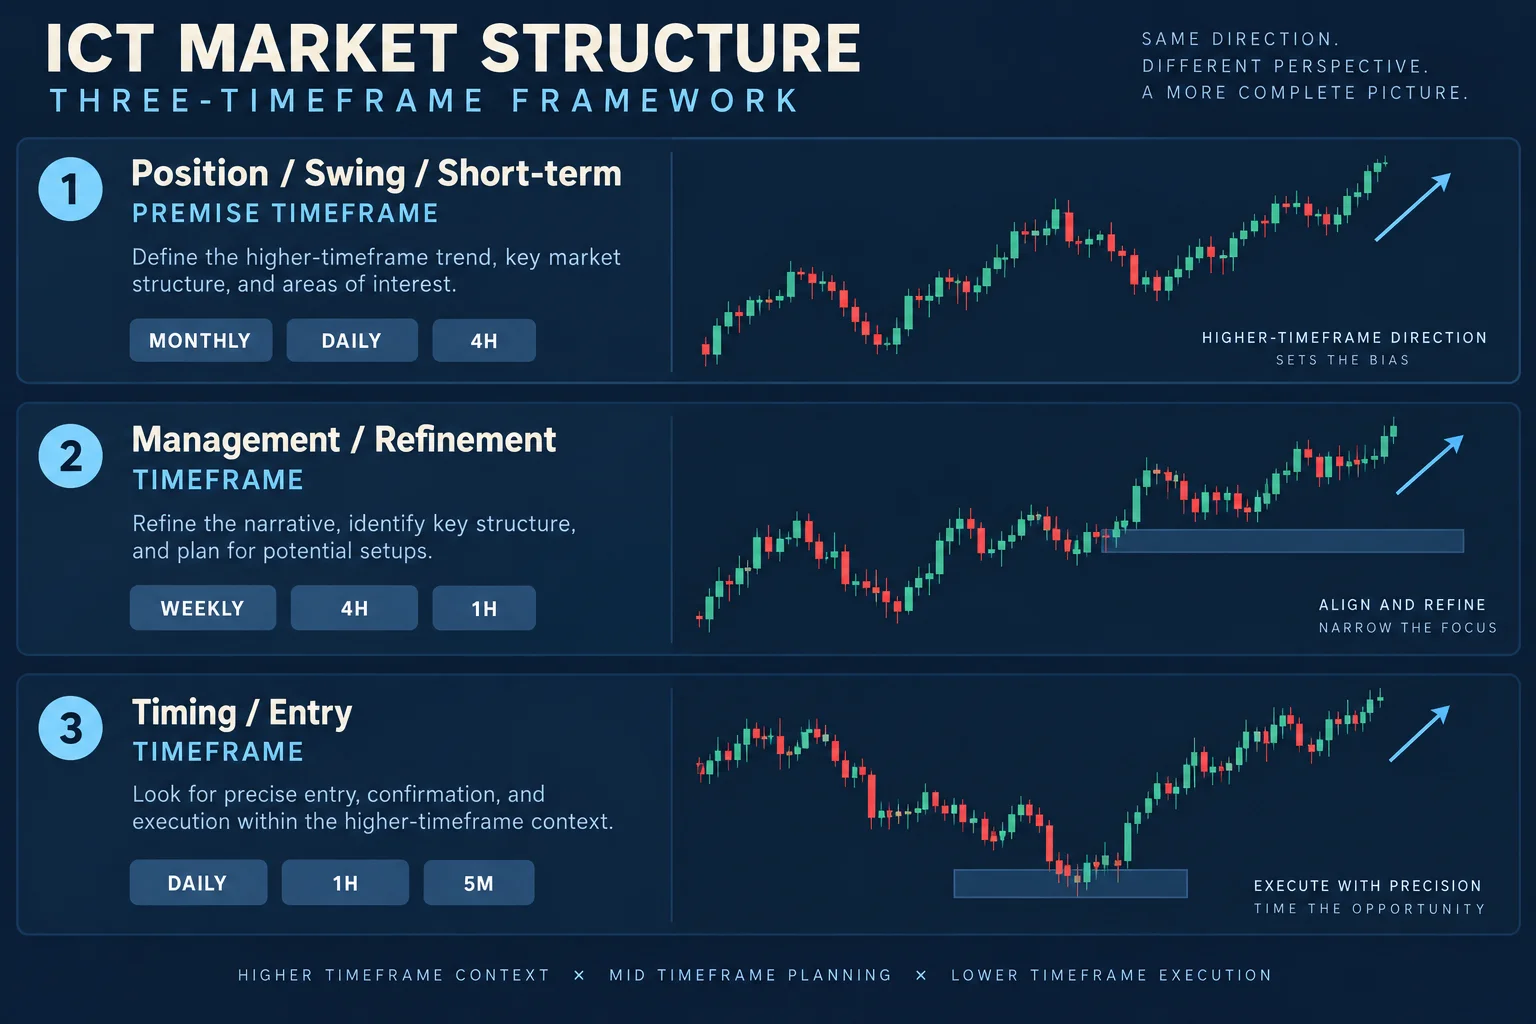
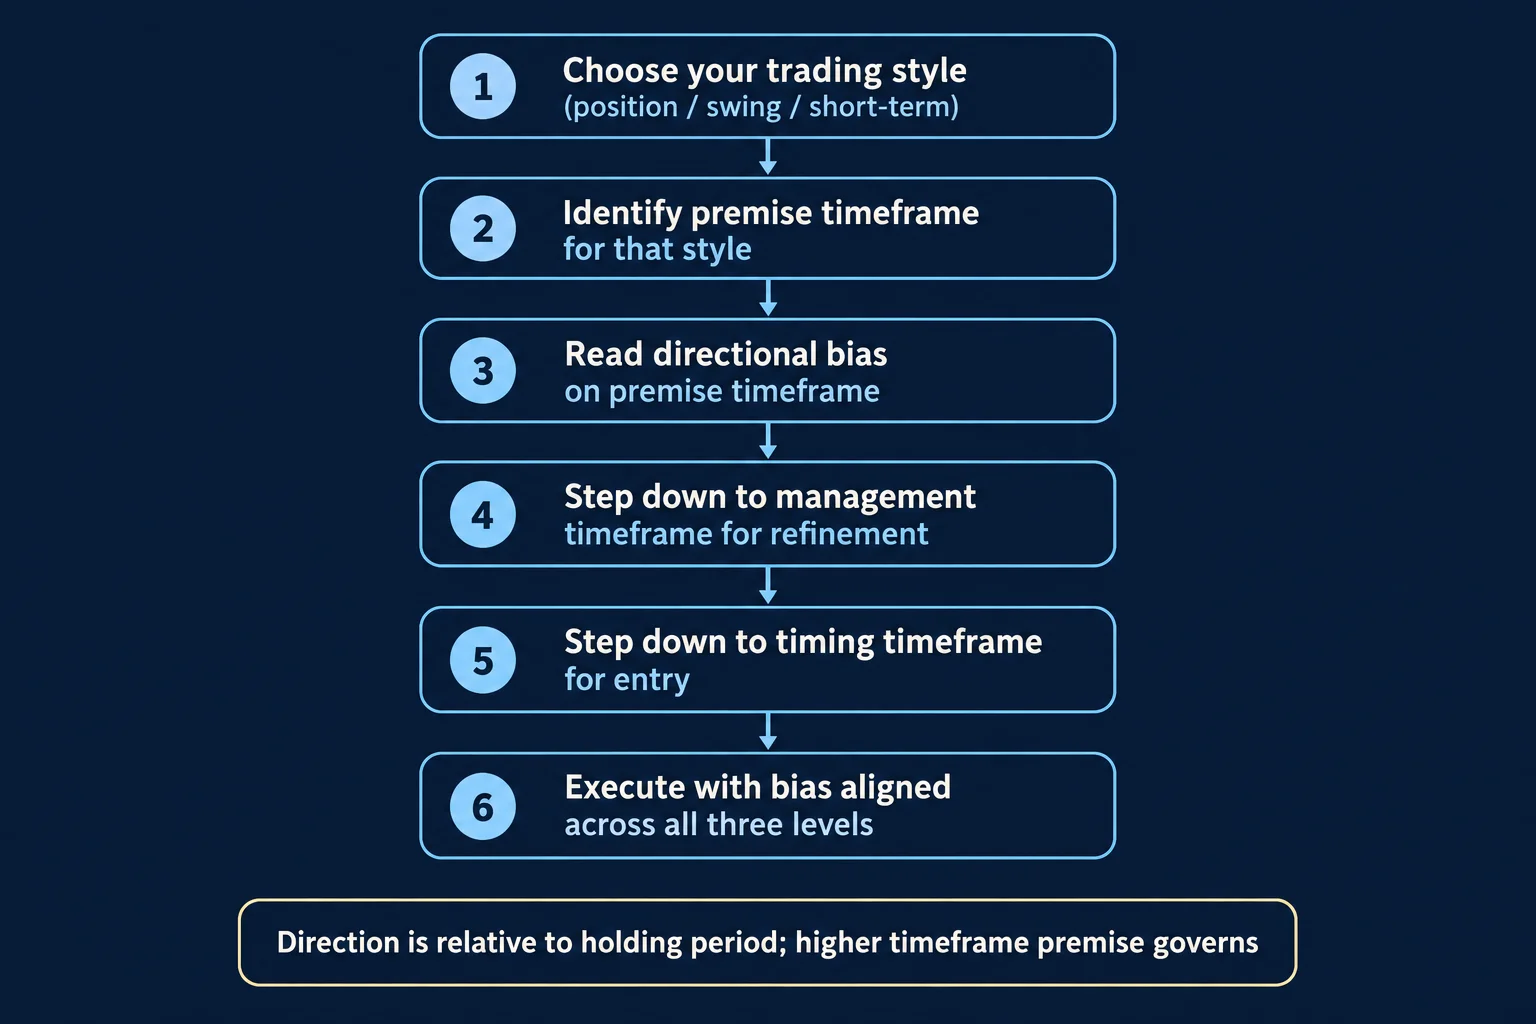
The lesson’s strongest general planning principle is role separation. Higher charts provide context; middle charts refine structure; lower charts introduce intraday levels and timing references. Templates then preserve that structure. Anyone studying the framework would still need to define each term precisely, verify time-zone settings, and test the rules independently before drawing conclusions about usefulness. The transcript shows a proposed analytical process, not trade fills, chart values, or subsequent performance.
Watch the lesson
You can watch the full lesson here:
If the video does not play above, open it directly on YouTube: https://www.youtube.com/watch?v=P2rRlaZCUlA
References
- ICT – Trading Plan Development 4 (Primary video): https://www.youtube.com/watch?v=P2rRlaZCUlA
- ICT Trading Plan Development 5 — next video in the series (covers additional timeframe tools and workflow): https://www.youtube.com/watch?v=P2rRlaZCUlA (Note: verify video ID for Part 5 separately)
- Commitment of Traders (COT) Reports — CFTC official data referenced in the weekly timeframe section: https://www.cftc.gov/MarketReports/CommitmentsofTraders/index.htm
- MetaTrader 4 Templates documentation — for saving and loading chart templates: https://www.metatrader4.com/en/trading-platform/help/interface/templates





