
Key takeaways
ICT’s Trading Plan Development 2 lesson, uploaded December 24, 2017, teaches traders to classify market conditions as consolidation or range, valid or false breakout, trend, or reversal before selecting analysis and setups.
Read the full summary
ICT’s Trading Plan Development 2 lesson, uploaded December 24, 2017, teaches traders to classify market conditions as consolidation or range, valid or false breakout, trend, or reversal before selecting analysis and setups. Higher-time-frame structure, support, resistance, swing points, and range boundaries determine directional bias and holding expectations, with bearish ranges favoring Optimal Trade Entry shorts or Turtle Soup false-breakout ideas near range highs and bullish ranges favoring entries near range lows after a sweep and quick recovery. ICT describes range expansion as a shift from average or small bars to larger bars, advises positioning during quieter consolidation instead of chasing acceleration, and notes that ranges can persist for weeks. Countertrend positions should generally be treated as brief intraday trades while setups aligned with broader structure may target larger swings. One example takes 70% off near a prior high and retains 30% for a possible breakout, presented as a preference rather than a universal rule. The planning process is to review higher time frames, assign a profile, mark key levels, establish directional bias, define scalp or swing expectations, avoid chasing price, and specify invalidation evidence. The lesson is conceptual, provides no verifiable instruments, prices, entries, fills, or results, and does not establish profitability or predictive reliability.
How we researched this article
BestProps used document-based research from primary firm sources, checked September 25, 2026. The complete source list, scope, limitations, and commercial-state record appear near the end of this article.
In ICT – Trading Plan Development 2, uploaded on December 24, 2017, ICT argues that a trading plan should begin by identifying the current market conditions. His central point is that traders should not apply the same setup indiscriminately: the analysis and expectations used in a consolidation may differ from those used during a trend, breakout, or reversal.
This lesson is conceptual rather than a documented trade walkthrough. ICT refers to diagrams in the video, but the captions do not provide their prices, instruments, or complete visual details. The discussion therefore supports an explanation of his market-profiling framework, not verification of particular entries, fills, or results.
Four ICT Market Profiles for Your Trade Plan
At 2:01, ICT divides market conditions into four broad categories:
- Consolidation or range
- Breakout, including valid and false breakouts
- Trend
- Reversal
He presents profiling as a preliminary decision: first determine the market conditions, then choose analysis suited to them. He also describes a recurring sequence in which price moves from consolidation into range expansion and eventually returns to consolidation. According to ICT, this pattern can appear across time frames, although that statement is his interpretation rather than a result established by the transcript.
ICT Trade Planning in a Consolidating Market
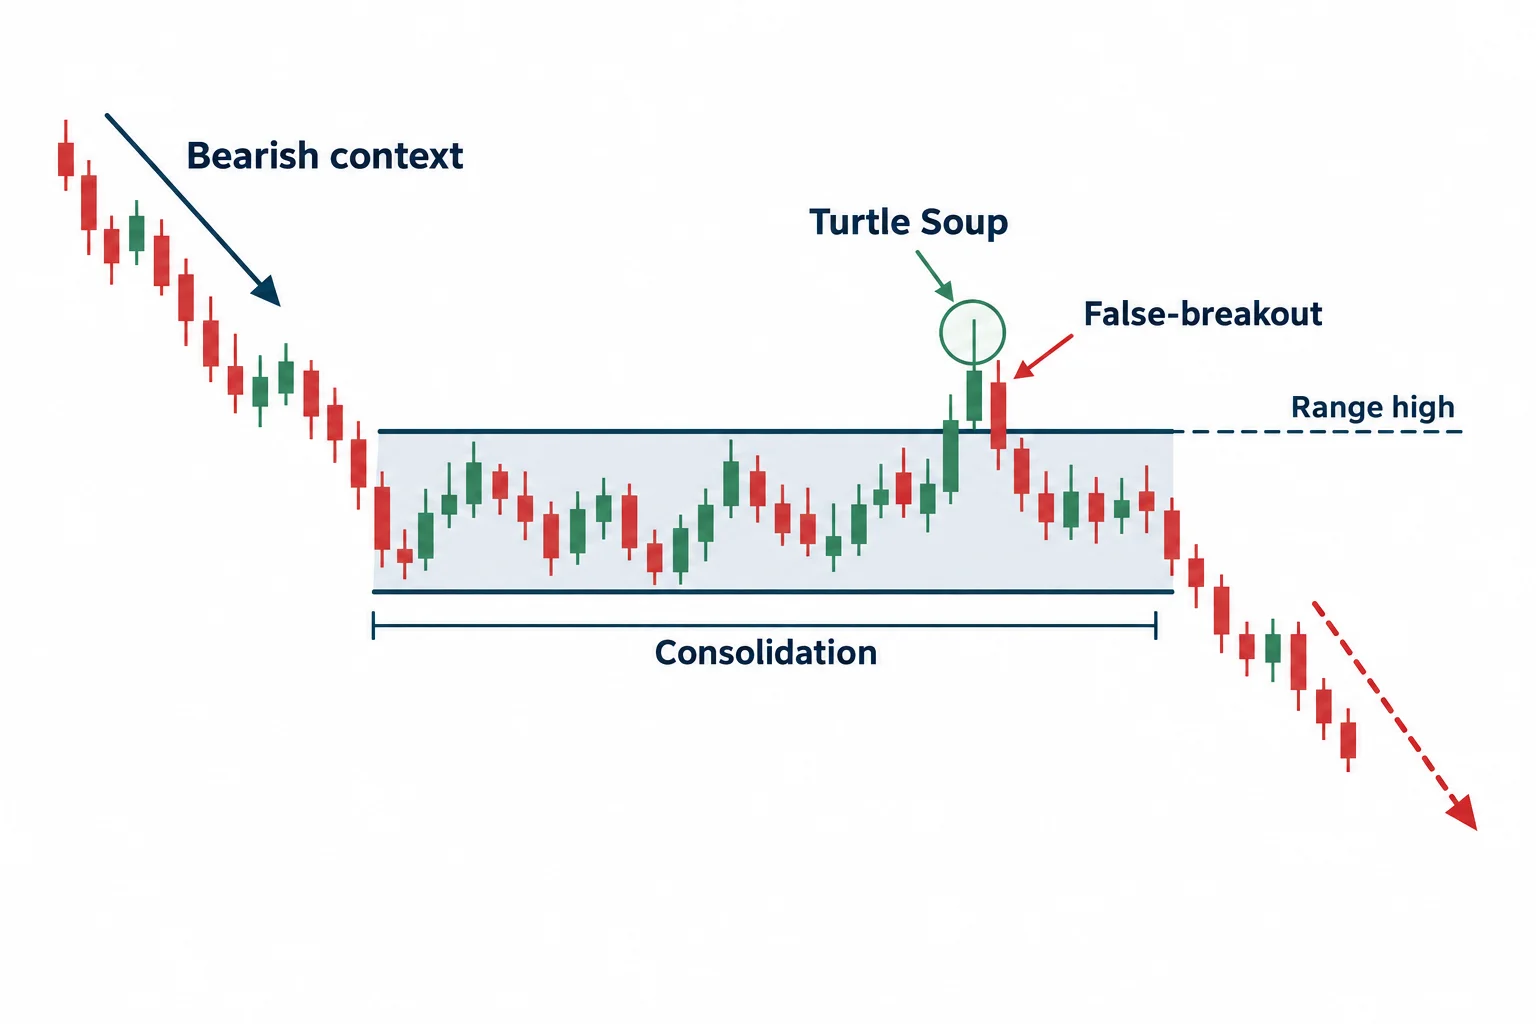
ICT’s first extended example places a consolidation inside a bearish market. Beginning around 3:12, he says the higher-time-frame direction should influence what a trader looks for inside the range. In his bearish illustration, that means concentrating on potential short setups near the upper portion of the consolidation rather than treating both directions equally.
He names two concepts for that situation: an “optimal trade entry” short pattern and a “Turtle Soup” false-breakout pattern near the range high. These labels belong to the methodology discussed in the lesson; the transcript does not define all of their entry rules. The broader planning principle is clearer: use the range boundaries and larger directional context to narrow the scenarios under consideration.
At 5:40, ICT contrasts advance positioning during consolidation with chasing price after a breakout. In the bearish example, he discusses selling rallies while price remains within the range. Once price has already accelerated, he advises waiting for another opportunity rather than entering merely because the move is visible.
ICT Market Planning for Quiet Periods and Range Expansion
A key distinction appears at 7:03. ICT describes range expansion as a transition from average or relatively small bars to larger bars. He encourages traders to pay attention during quieter consolidation periods, which he interprets as preparation for a subsequent move.
His bullish example applies the same logic in reverse. At 8:16, he discusses looking near the lower boundary of a consolidation when the larger context is bullish. He also describes a move below an important swing low followed by a quick recovery as a possible false-breakout clue. In his framework, bullish entries would be considered while price is temporarily moving down, rather than after it has already surged higher.
Higher Time Frames Guide Your ICT Market Plan
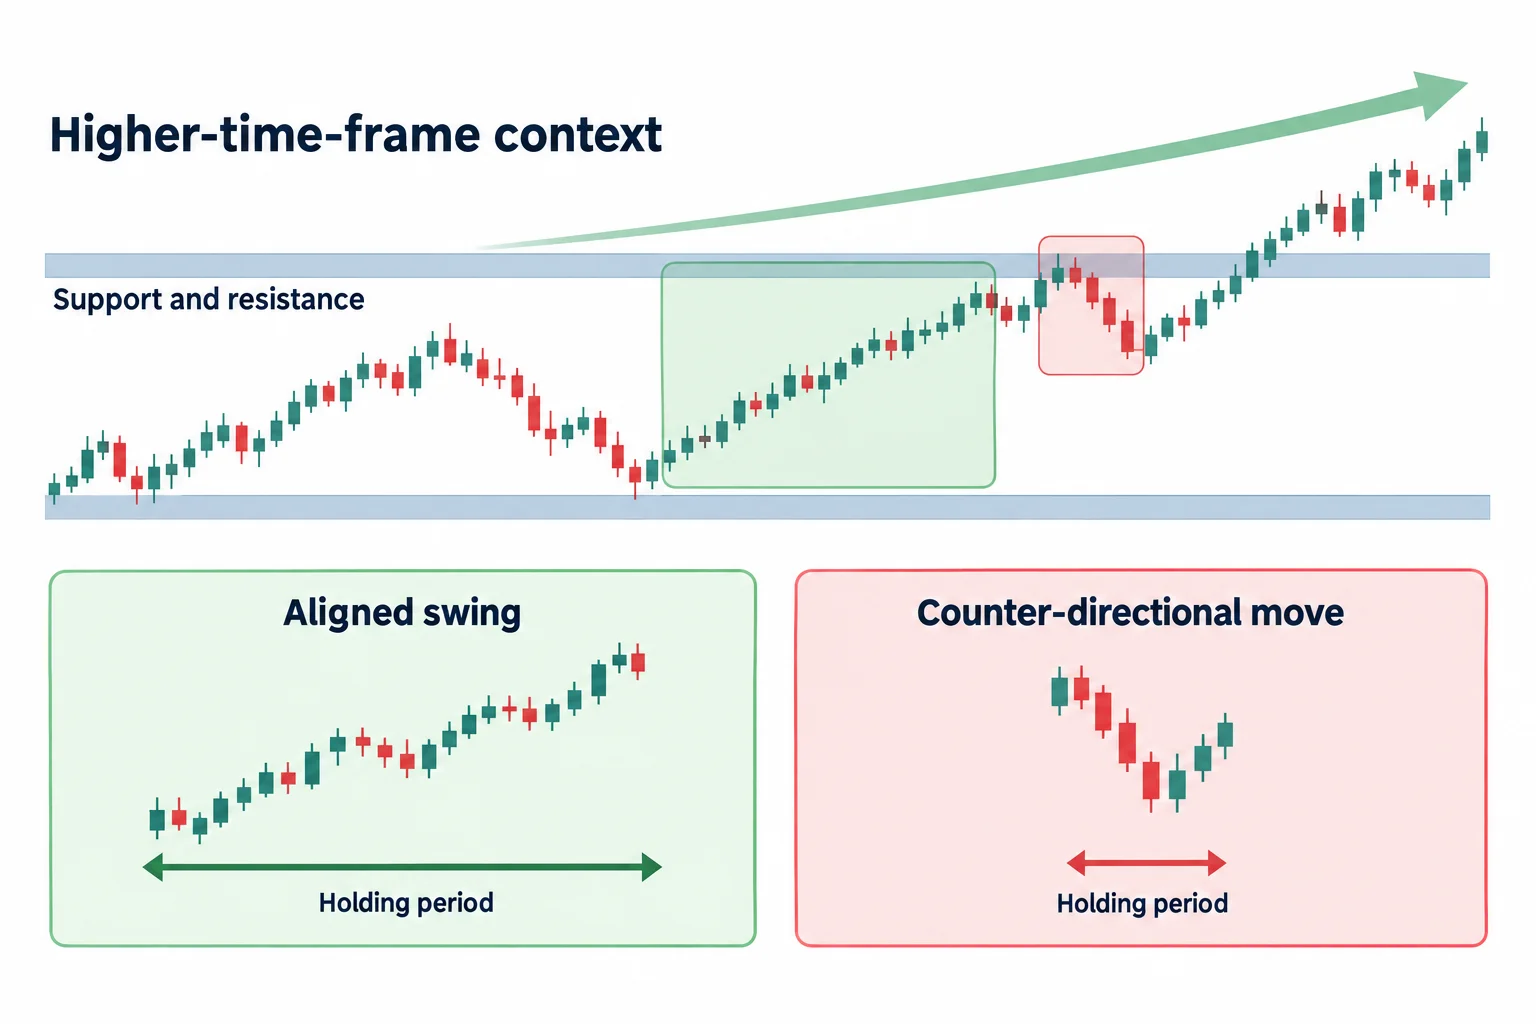
From 9:49, ICT outlines a sequence involving a downtrend, a reversal, a retracement, and a possible consolidation. He says higher-time-frame support and resistance can help form expectations about whether a retracement is part of a larger move. He explicitly emphasizes price structure and higher-time-frame levels in this section rather than indicators.
That context also affects the intended holding period. In a market interpreted as broadly bullish, ICT says short positions might be treated only as brief intraday trades, while long setups could be considered for larger swings. The reverse logic is presented later for a market that has risen, formed a possible high, and retraced into consolidation: counter-directional buys would receive more limited expectations, while the primary focus would shift toward shorts.
ICT also warns that a range can persist for weeks. Around 11:54, he recommends keeping objectives within established boundaries rather than assuming every move beyond a high or low will continue. He gives an opinion-based example of taking 70% of a position off near a prior high and retaining 30% in case of a breakout. Those percentages are ICT’s stated preference in the example, not a universal risk rule or a demonstrated optimal allocation.
Applying ICT Market Profiling to Your Trade Plan
The lesson can be translated into a simple pre-trade planning checklist without assuming that its setups are profitable:
- Review higher time frames before focusing on an entry chart.
- Classify the market as a range, breakout, trend, or possible reversal.
- Mark significant support, resistance, swing points, and range boundaries.
- Decide which direction the larger structure appears to support.
- Set expectations appropriate to the profile, including whether a trade idea is a short scalp or a broader swing.
- Avoid entering solely because price has already accelerated.
- Define in advance what evidence would invalidate the profile.
The final summary at 16:08 reinforces the main lesson: determine the profile first and use tools suited to those market conditions. ICT contends that trend-oriented analysis may be less appropriate during a reversal profile. Educationally, the durable takeaway is not that a profile predicts the next move with certainty, but that explicitly naming the assumed market conditions can make a trading plan more coherent and easier to review.
This article summarizes ICT’s interpretation of market behavior for educational purposes. It is not investment advice, and the transcript does not establish profitability or predictive reliability.




