
How we researched this article
BestProps used document-based research from primary firm sources, checked September 25, 2026. The complete source list, scope, limitations, and commercial-state record appear near the end of this article.
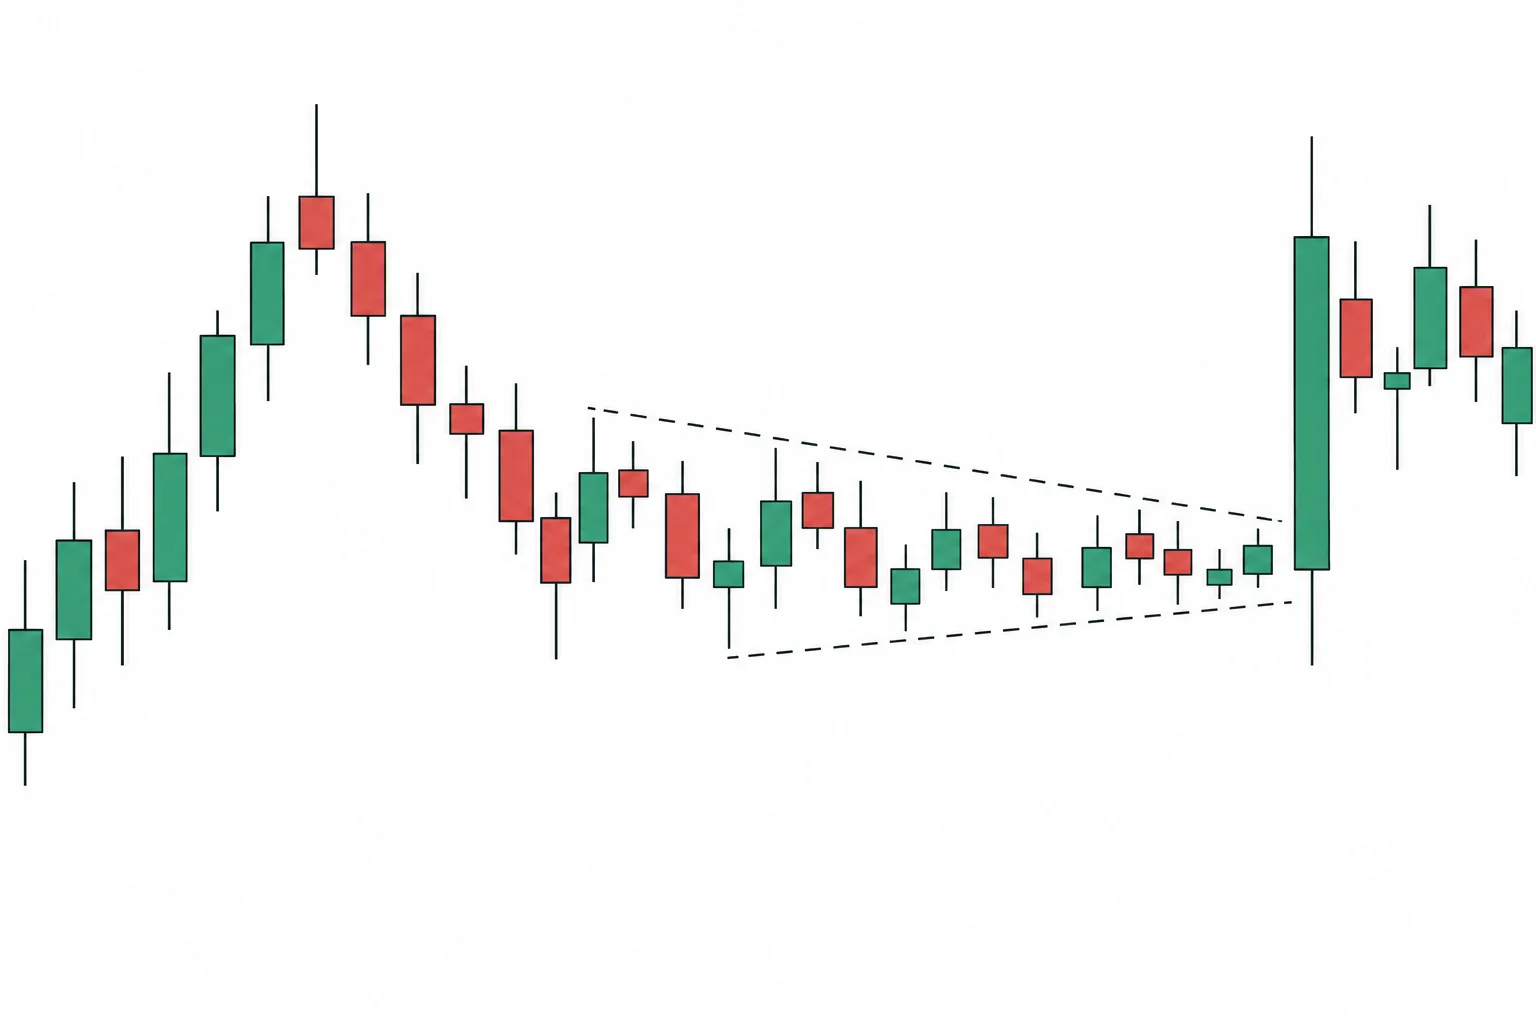
In ICT Forex Scout Sniper Basic Field Guide – Vol. 7, ICT focuses on three connected subjects: changes in daily range, stop management, and taking profits in stages. The broader lesson is to define a trade by its timeframe and its relationship to higher-timeframe direction before deciding how aggressively to reduce the position.
This is a summary of ICT’s framework, not evidence that the methods provide a trading edge. The examples are hypothetical chart walkthroughs, and the transcript does not establish actual entries, fills, costs, or subsequent account performance.
Daily-range contraction as a volatility alert
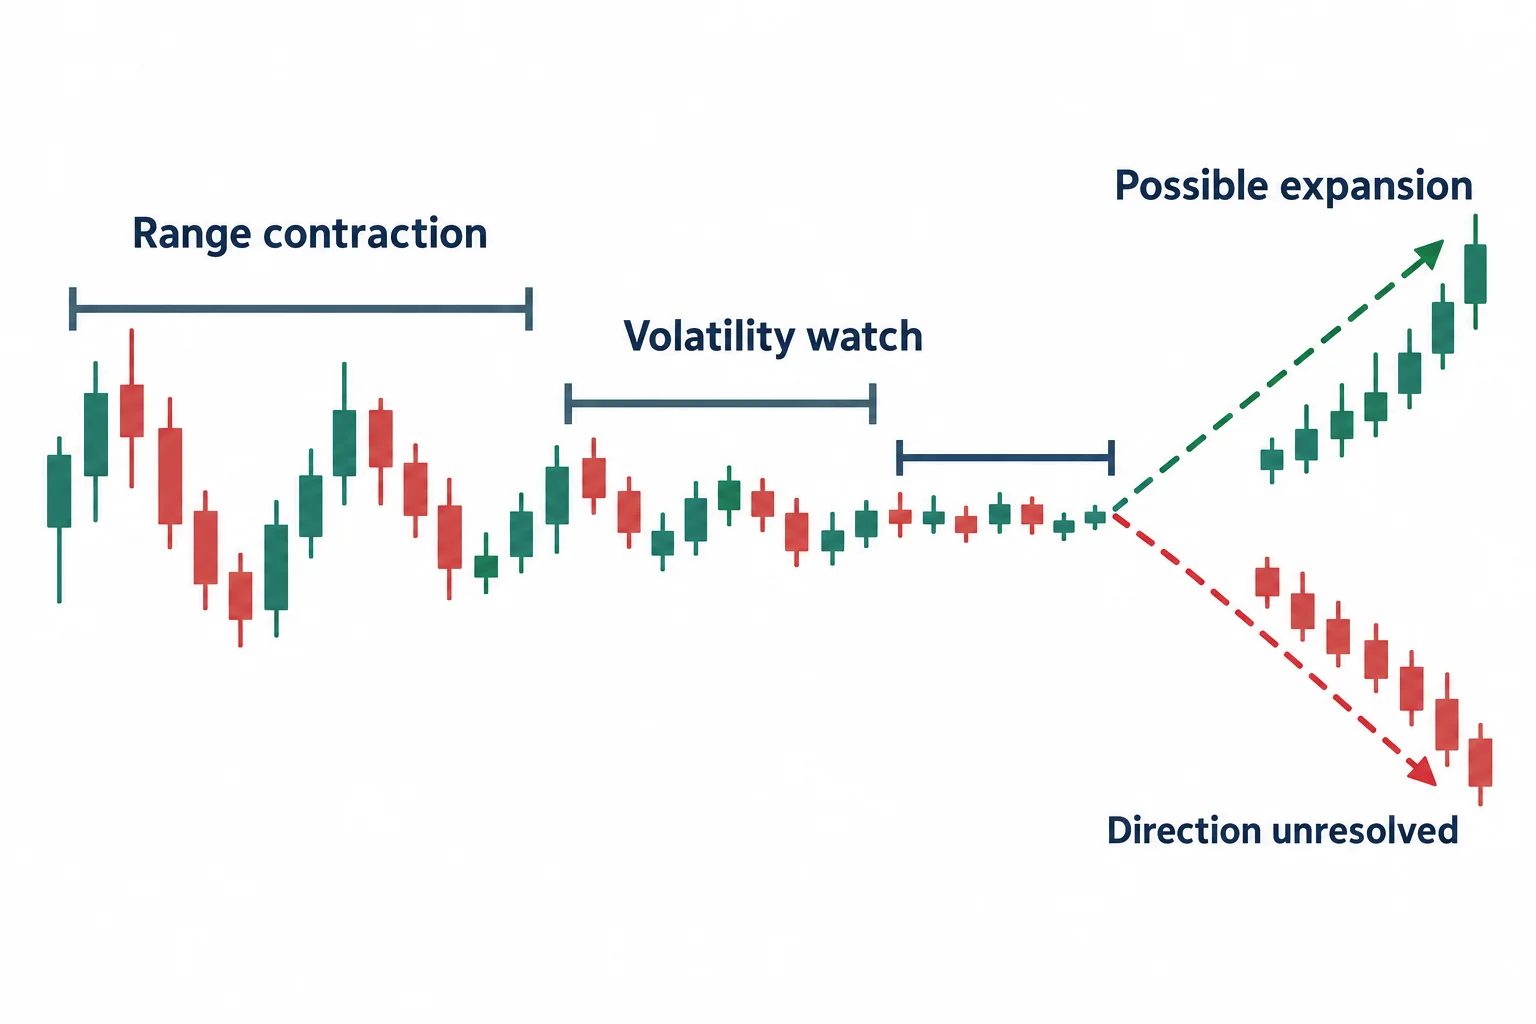
ICT begins the chart lesson with a EUR/USD 15-minute example and compares several daily high-to-low ranges. At 5:16, he explains that his chart tool plots the preceding day’s high and low. He then points to a sequence in which daily ranges become smaller before expanding again.
His key qualification appears at 7:55: contraction is not a directional signal. In ICT’s interpretation, a run of relatively narrow daily ranges warns that volatility may expand, but it does not determine whether the next move will be up or down. Direction is instead meant to come from the wider analytical framework, including the daily chart and the moving-average model introduced elsewhere in the series.
A useful general distinction follows from this section:
- Range analysis describes how much price has recently moved.
- Directional analysis addresses which side of the market a trader expects to favor.
- Execution rules specify when an idea may be acted upon and where its risk is invalidated.
Those are separate decisions. A volatility observation alone does not justify a long or short position.
The illustrative 30-pip stop framework
At 13:04, ICT revisits stop placement. He says he mentally uses a generic 100-pip daily range for EUR/USD and GBP/USD, while explicitly acknowledging that actual daily ranges can be much smaller or larger. He derives an illustrative stop of roughly 30 pips from about one-third of that reference range.
This is presented as part of his selective “one shot, one kill” weekly framework, not as a universal stop distance. In the walkthrough, he first assumes a bullish higher-timeframe environment. He then discusses looking for a weekly low during the early part of the week and narrowing attention to his defined London or New York trading windows.
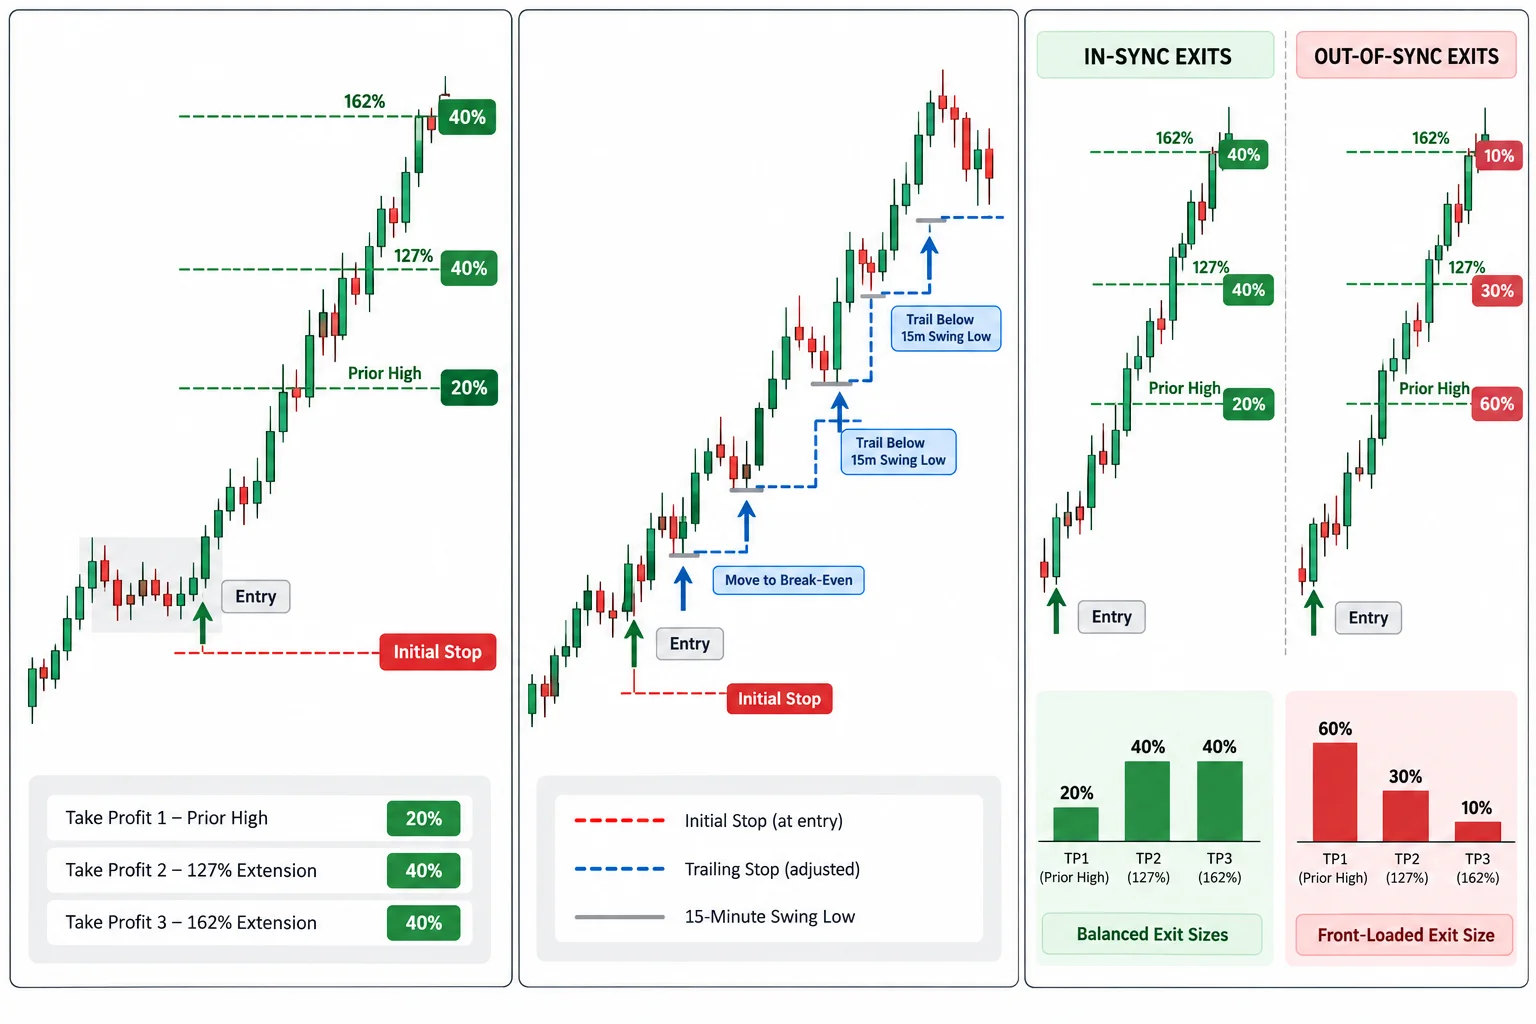
ICT uses a historical chart scenario to show why an entry need not capture the exact low. Around 23:51, he begins constructing a hypothetical long entry and later places a roughly 30-pip stop beneath it. His argument is that time, directional context, and location should work together; the stop distance is not intended to rescue an arbitrary entry.
He then demonstrates a trailing method based on recent 15-minute swing lows. As price hypothetically advances, the stop is raised beneath the relevant recent lows rather than moved in response to nervousness. At 30:53, he contrasts following those rules with reacting emotionally to a temporary decline.
Classifying trades as in sync or out of sync
The lesson next classifies trades by the timeframe used for analysis. At 38:25, ICT describes daily analysis as intermediate-term or swing trading, four-hour analysis as short-term trading, one-hour analysis as day trading, and 15- or five-minute work as scalping.
He calls a trade in sync when its direction agrees with the daily and/or four-hour premise. A lower-timeframe position against that premise is out of sync. ICT’s management principle is straightforward: retain more exposure when the trade agrees with the higher-timeframe view, but realize profits sooner when trading against it.
This classification is central to the video because it connects analysis to management. Instead of choosing exits only from an account-profit figure, ICT wants each partial exit associated with a chart reference such as an old high or low, a range objective, or one of his Fibonacci extension levels.
ICT’s split-gain ratio templates
Beginning at 47:02, ICT introduces “split gain ratios.” These are templates for dividing a position across multiple exits. He repeatedly says they are examples designed to stimulate planning, not fixed formulas that must always be followed.
Intermediate-term examples
- In sync: five equal 20% exits, four 25% exits, or a 20%/40%/40% structure.
- Out of sync: take a larger initial portion, such as 40%, 50%, or 60%, then divide the remainder among later objectives.
Short-term and day-trading examples
For an in-sync short-term trade, ICT gives examples such as 30%/35%/35% or 25% followed by 75%. Out-of-sync examples remove 60% or 80% at the first objective. In the day-trading section at 59:13, he again proposes leaving a larger remainder only when the position aligns with the wider premise. When direction is unclear, his simpler “double tap” template takes half at one objective, moves risk toward break-even, and leaves half for a second objective.
Scalping
At 1:01:48, ICT describes scalping here as pursuing approximately 15–30 pips, not just a few pips. Management is deliberately simpler: either hold for the planned stop or target, reduce risk when possible, or take half off after favorable movement and manage the balance.
The practical educational takeaway
The ratios are less important than the planning sequence behind them:
- Define the analytical timeframe.
- Determine whether the idea agrees with the higher-timeframe premise.
- Identify chart-based objectives before entry.
- Decide in advance how much would be removed at each objective.
- Specify how the stop would be managed if price moves favorably.
Near 1:04:20, ICT stresses that the stated ratios are adjustable. His underlying message is to avoid treating a forecast as certain and to plan partial exits before emotions arise. He closes by assigning a review of the preceding lessons and previewing the eighth installment’s top-down flowchart.
These ideas are educational frameworks rather than investment advice. Fixed pip stops, partial exits, and timeframe alignment do not eliminate losses, and the appropriate risk for any transaction cannot be determined from this video alone.
Additional Resources
- Investopedia – Forex Trading Strategies & Risk Management (educational reference; not ICT-specific)
- Investopedia – Fibonacci Retracement & Extensions (mathematical reference for the extension levels discussed)
- SEC Investor Alert – Day Trading Risks (regulatory risk disclosure)




