
How we researched this article
BestProps used document-based research from primary firm sources, checked September 25, 2026. The complete source list, scope, limitations, and commercial-state record appear near the end of this article.
Volume 6 of ICT’s Forex Scout Sniper Basic Field Guide shifts the series toward risk control. ICT first revisits Fibonacci-based swing projections and then spends most of the lesson discussing position sizing, loss reduction, time stops, partial exits, and trailing stops. These are ICT’s interpretations and preferred practices, not evidence that the methods produce a trading edge.
Watch ICT Forex Scout Sniper Basic Field Guide – Vol. 6 on YouTube.
Lesson overview
At 0:48, ICT identifies risk reduction and risk control as the central subjects. He acknowledges that trading risk cannot be eliminated completely. The stated agenda includes reviewing swing targets, comparing risk as a percentage of equity, placing stop-loss orders, reducing exposure in open positions, and distinguishing active risk reduction from simply abandoning a trade.
Reviewing Fibonacci swing projections
The chart review begins at 2:45. ICT demonstrates how he anchors Fibonacci projections to a price swing after a market-structure level has been broken. He repeatedly refers to the 127%, 162%, and 200% extensions as possible objectives.
His main qualification is important: he does not treat the 200% extension as mandatory. Around 6:26, he says he prefers the 127% and 162% areas rather than assuming price must reach 200%. He also frames the 200% projection as a measured-move idea—roughly projecting the original range beyond the relevant reference point.
ICT applies the concept across several time frames and currency pairs. The examples include EUR/USD, the Canadian dollar pair shown in the presentation, and GBP/USD. Because the transcript does not identify every ticker clearly and the charts are not reproduced here, exact anchors, prices, and later outcomes cannot be independently reconstructed from the captions alone.
In general educational terms, a projection is best understood as a planning reference rather than a forecast. ICT likewise says the Fibonacci level should not stand alone: near 20:54, he discusses combining projected objectives with such contextual features as earlier highs or lows, support and resistance, and time-of-day or day-of-week considerations.
Define monetary risk before calculating position size
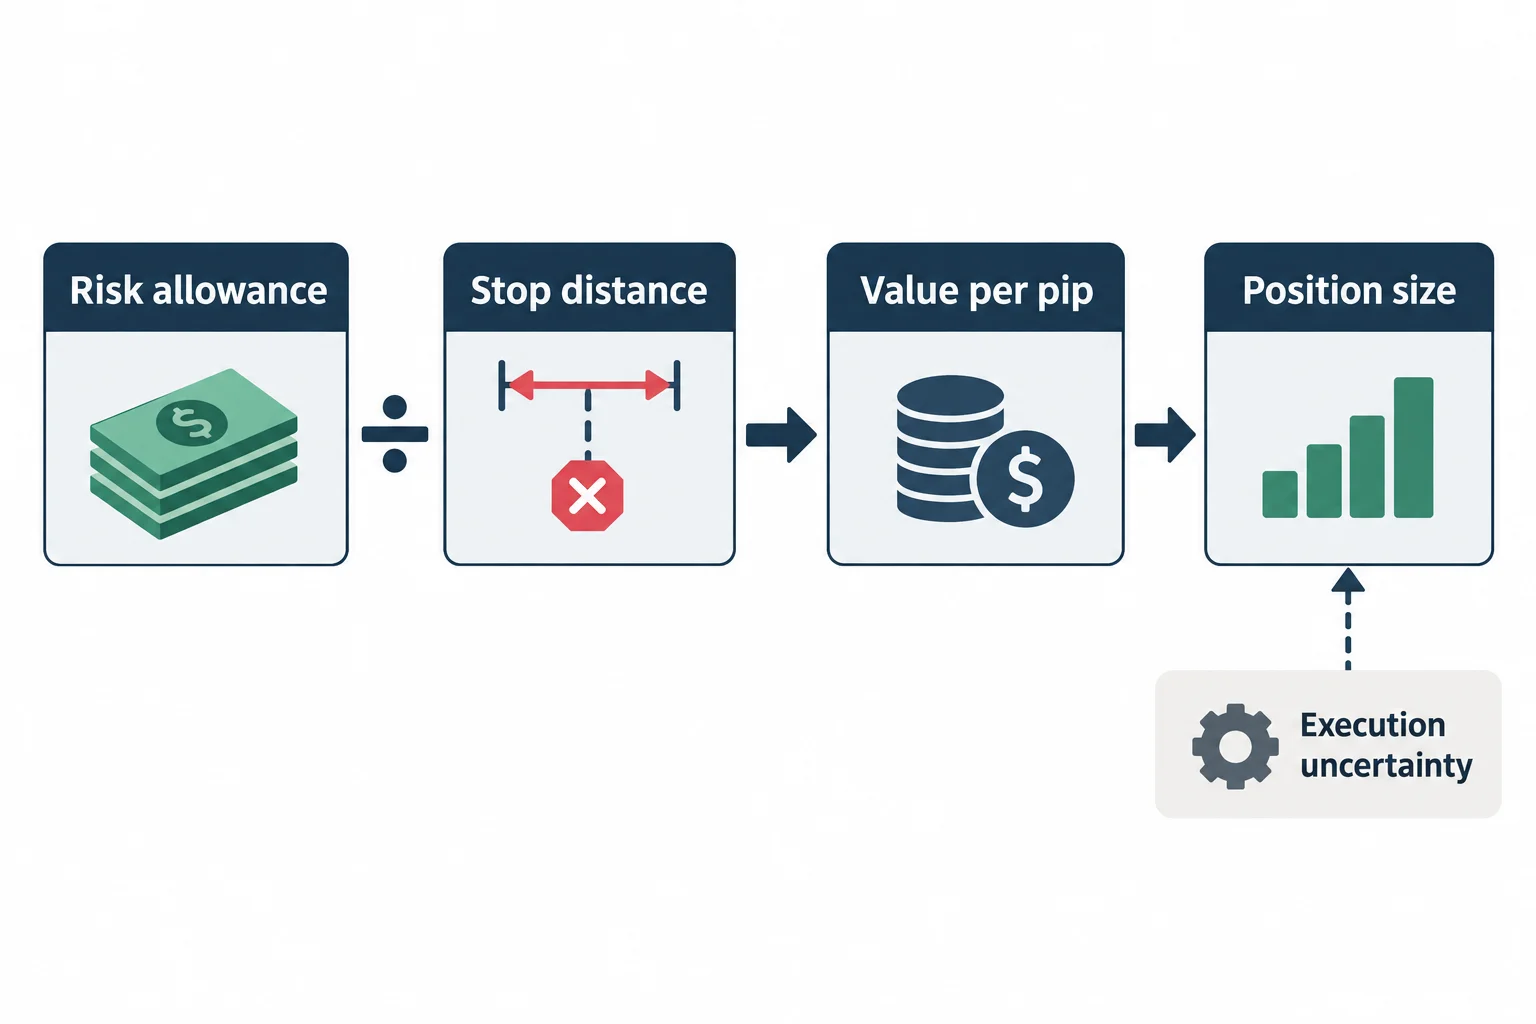
The risk discussion becomes explicit at 22:38. ICT notes that 2% of equity per trade is commonly discussed, but says he generally prefers 1% or less for developing traders. His example uses a $10,000 account:
- At 1% risk, the maximum planned loss is $100.
- At 2% risk, the maximum planned loss is $200.
- The chosen stop distance is then used to calculate the value per pip and corresponding position size.
For example, ICT divides a $100 risk allowance by a hypothetical 30-pip stop to arrive at approximately $3.33 per pip. This is an arithmetic illustration, not a recommendation to use that account size, stop distance, or exposure. Actual loss can exceed a planned amount when an order is filled at a worse price, which ICT acknowledges later when discussing gaps and slippage.
ICT also describes personally using higher percentages under selected conditions, but he presents that as dependent on his claimed experience and alignment among higher time frames. It should not be treated as a general risk standard or replicated without independent evaluation.
Reduce exposure after a loss
At 28:43, ICT proposes cutting the next trade’s percentage risk after a loss. In his example, a trader who loses 2% would risk 1% on the following attempt instead of immediately trying to recover the loss with equal or greater exposure.
The educational principle is to interrupt loss-chasing. Lower exposure reduces the financial effect of another loss and may lessen the emotional pressure to return immediately to a previous equity level. ICT further stresses that losses are unavoidable and that trading is not suitable for everyone.
Time stops: when a trade fails to progress
ICT introduces his time-stop framework at 34:51. Rather than holding a stagnant position indefinitely, he considers reducing or closing it when the anticipated move does not develop within a specified period.
- For a daily-chart setup, he allows roughly three days.
- For a four-hour setup, he allows about one day.
- For an hourly setup, he allows up to two trading sessions.
Possible responses include closing half the position, reducing the remaining monetary risk, moving the stop toward break-even where feasible, or exiting completely. These timing rules are ICT’s discretionary framework; the transcript does not provide testing that establishes them as optimal.
Progressive stop reduction without crowding price
Beginning around 38:00, ICT gives a hypothetical long-position example with an initial 30-pip stop. As price progresses, he describes reducing the remaining downside in stages rather than moving directly to break-even. His illustration narrows the risk from 30 pips to 20, then to 10 after an initial objective, and finally to break-even as price approaches another target.
His rationale is that moving a stop too quickly can leave it vulnerable to ordinary retracements. At the same time, no management technique creates a genuinely risk-free trade: gaps, slippage, and execution uncertainty can still produce an unexpected result.
The 15-minute trailing method
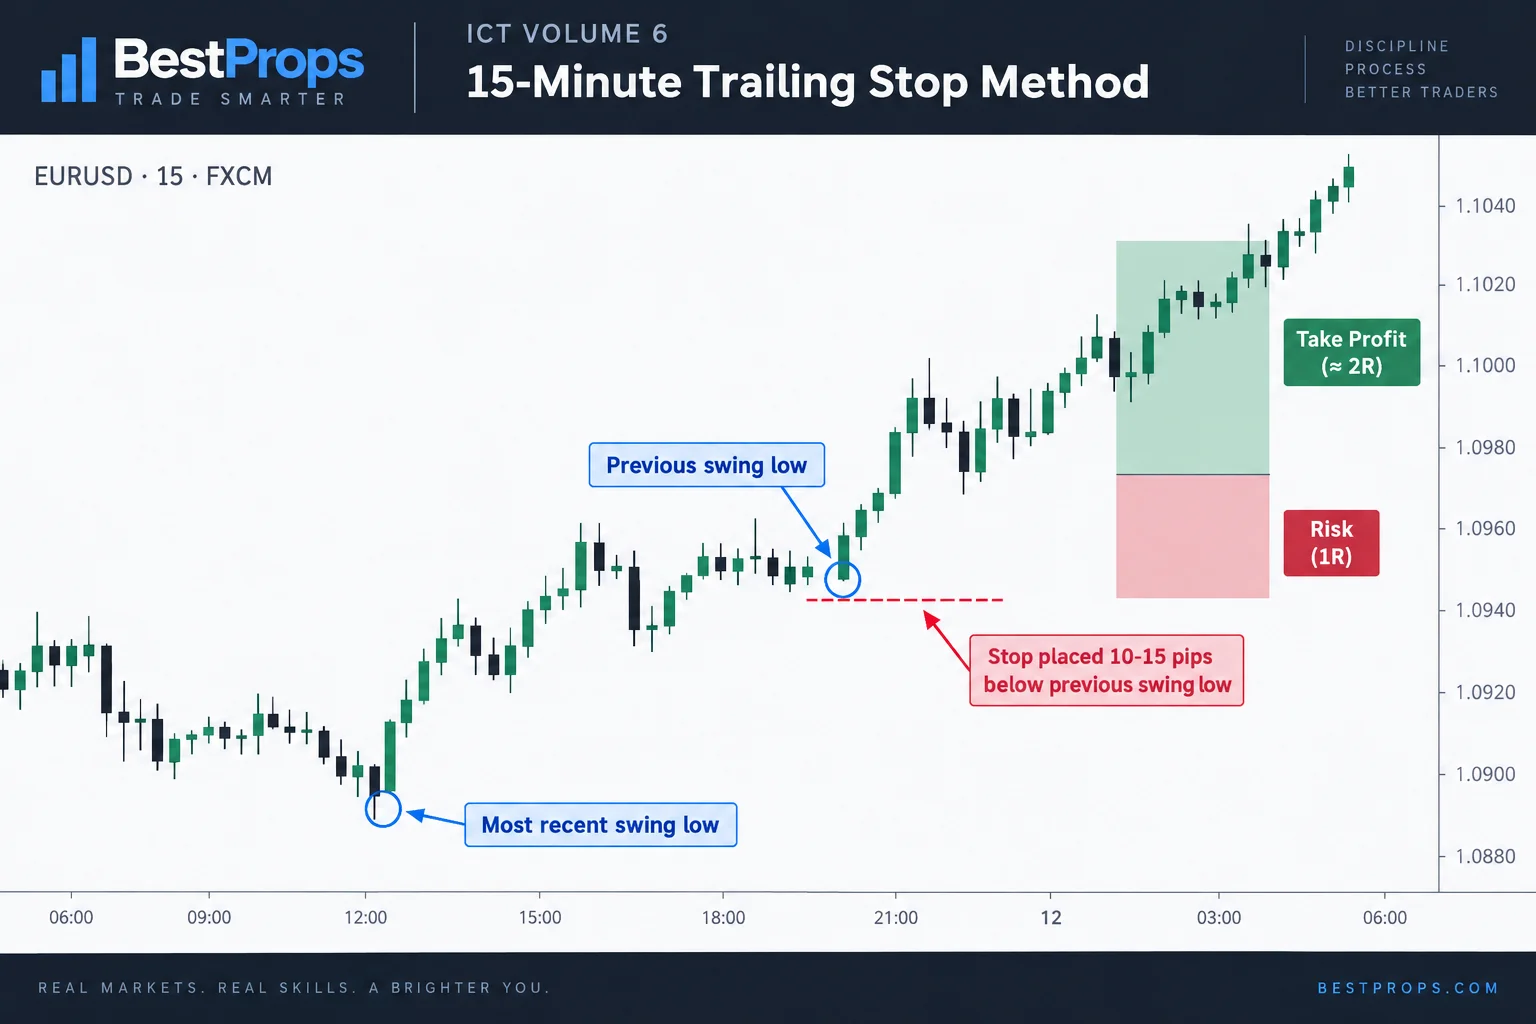
At 40:47, ICT explains that he uses a 15-minute chart to manage a position after the stop has reached break-even. For a bullish trade, he identifies the two most recent 15-minute swing lows and places the stop 10–15 pips beneath the earlier or lower relevant swing. For a bearish trade, he reverses the method, using recent swing highs and placing the stop above them.
The intention is to allow room for market structure to form higher highs and higher lows in a bullish move, or the inverse in a bearish move. The captions make the exact selection wording somewhat awkward, so viewers should consult the chart at 43:06 before attempting to reproduce the rule.
Partial profits and realistic objectives
ICT argues against trying to capture an entire move. Around 44:24, he describes taking some profit at an initial objective and allowing the remaining portion to pursue a later target. His broader message is that preserving capital takes priority over maximizing every trade.
The lesson closes with a practice exercise using a demo account. ICT suggests observing how trades behave around stops and targets, then rehearsing the trailing method over a sample of trades. This is presented as skill-building rather than proof of profitability. Volume 6 therefore contributes a structured risk-management layer to the series: predefine monetary exposure, reduce size after losses, reassess trades that fail to progress, and trail stops with enough room for normal fluctuation.





